Parks as Climate Infrastructure
Objective
Reframe New York City’s parks as essential climate infrastructure using spatial analysis and interactive mapping to identify funding opportunities, protect vulnerable communities, and make the case for treating parks like roads and bridges.
Tags
Challenge
Despite managing 14% of NYC’s land, parks have faced decades of chronic underfunding—receiving less than 1% of the city’s budget, well below national standards. Meanwhile, extreme weather, flooding, and urban heat are increasing citywide, with parks playing a critical but overlooked role in protecting neighborhoods.
Solution
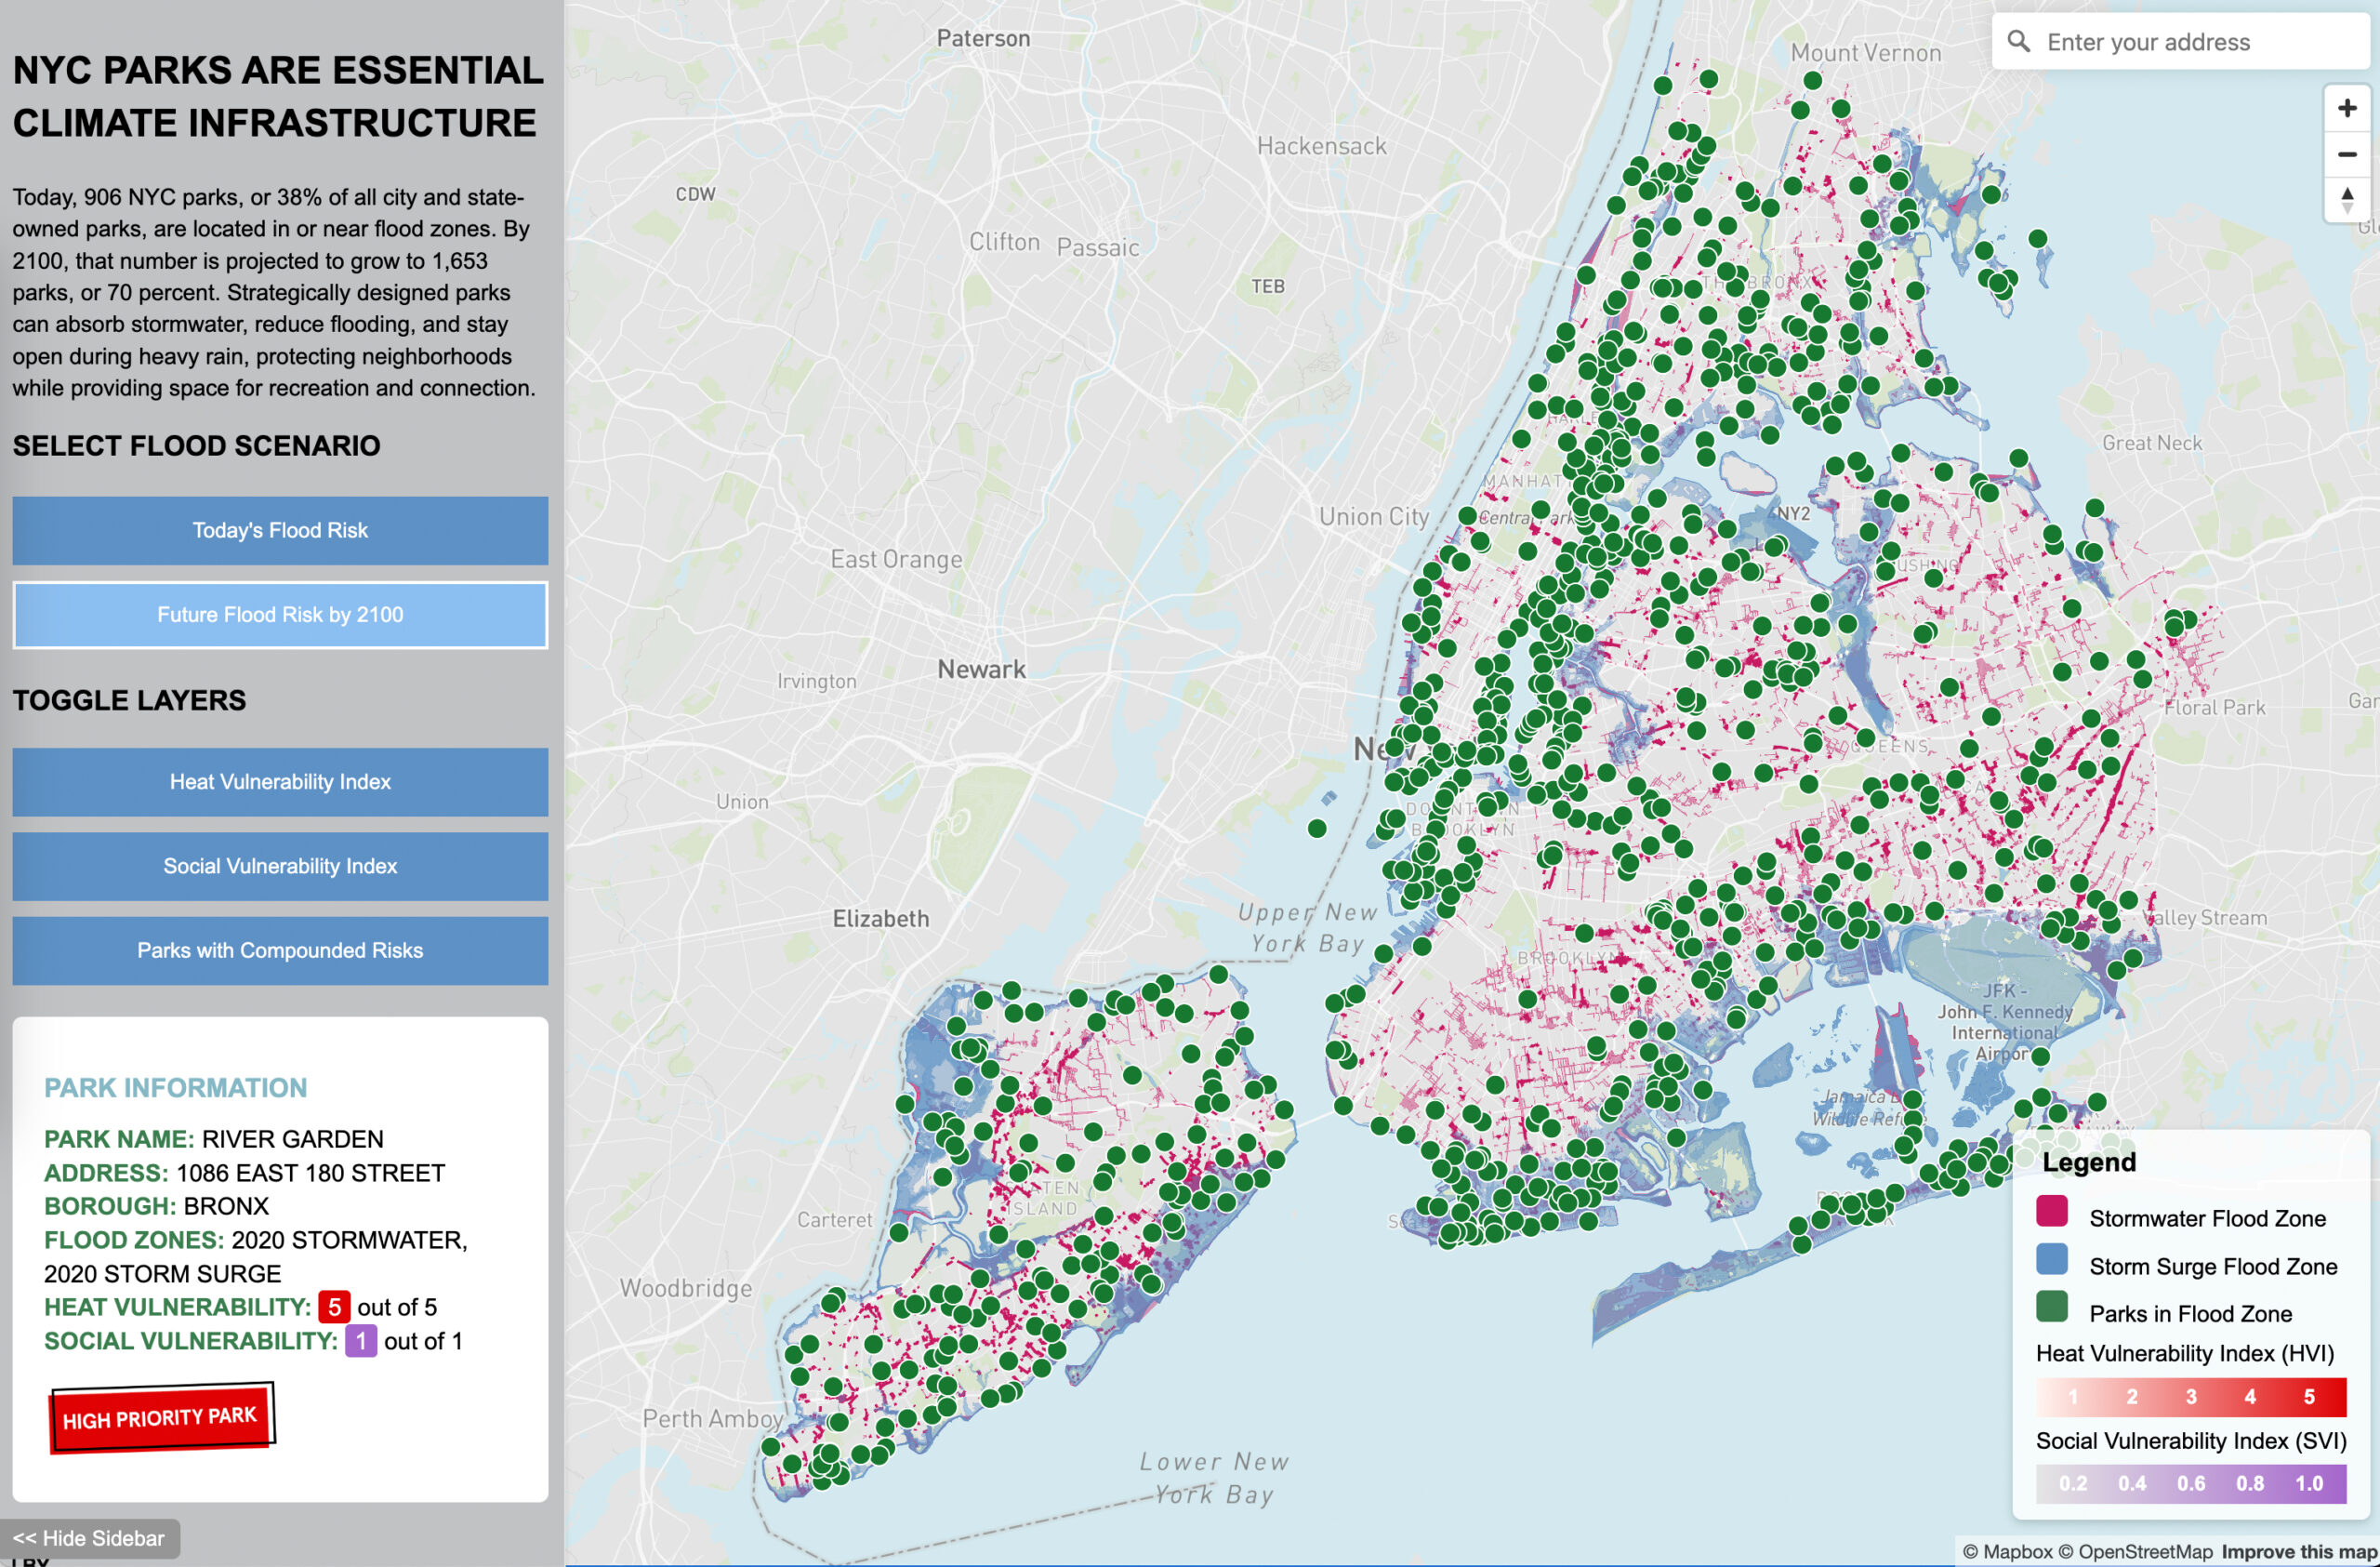
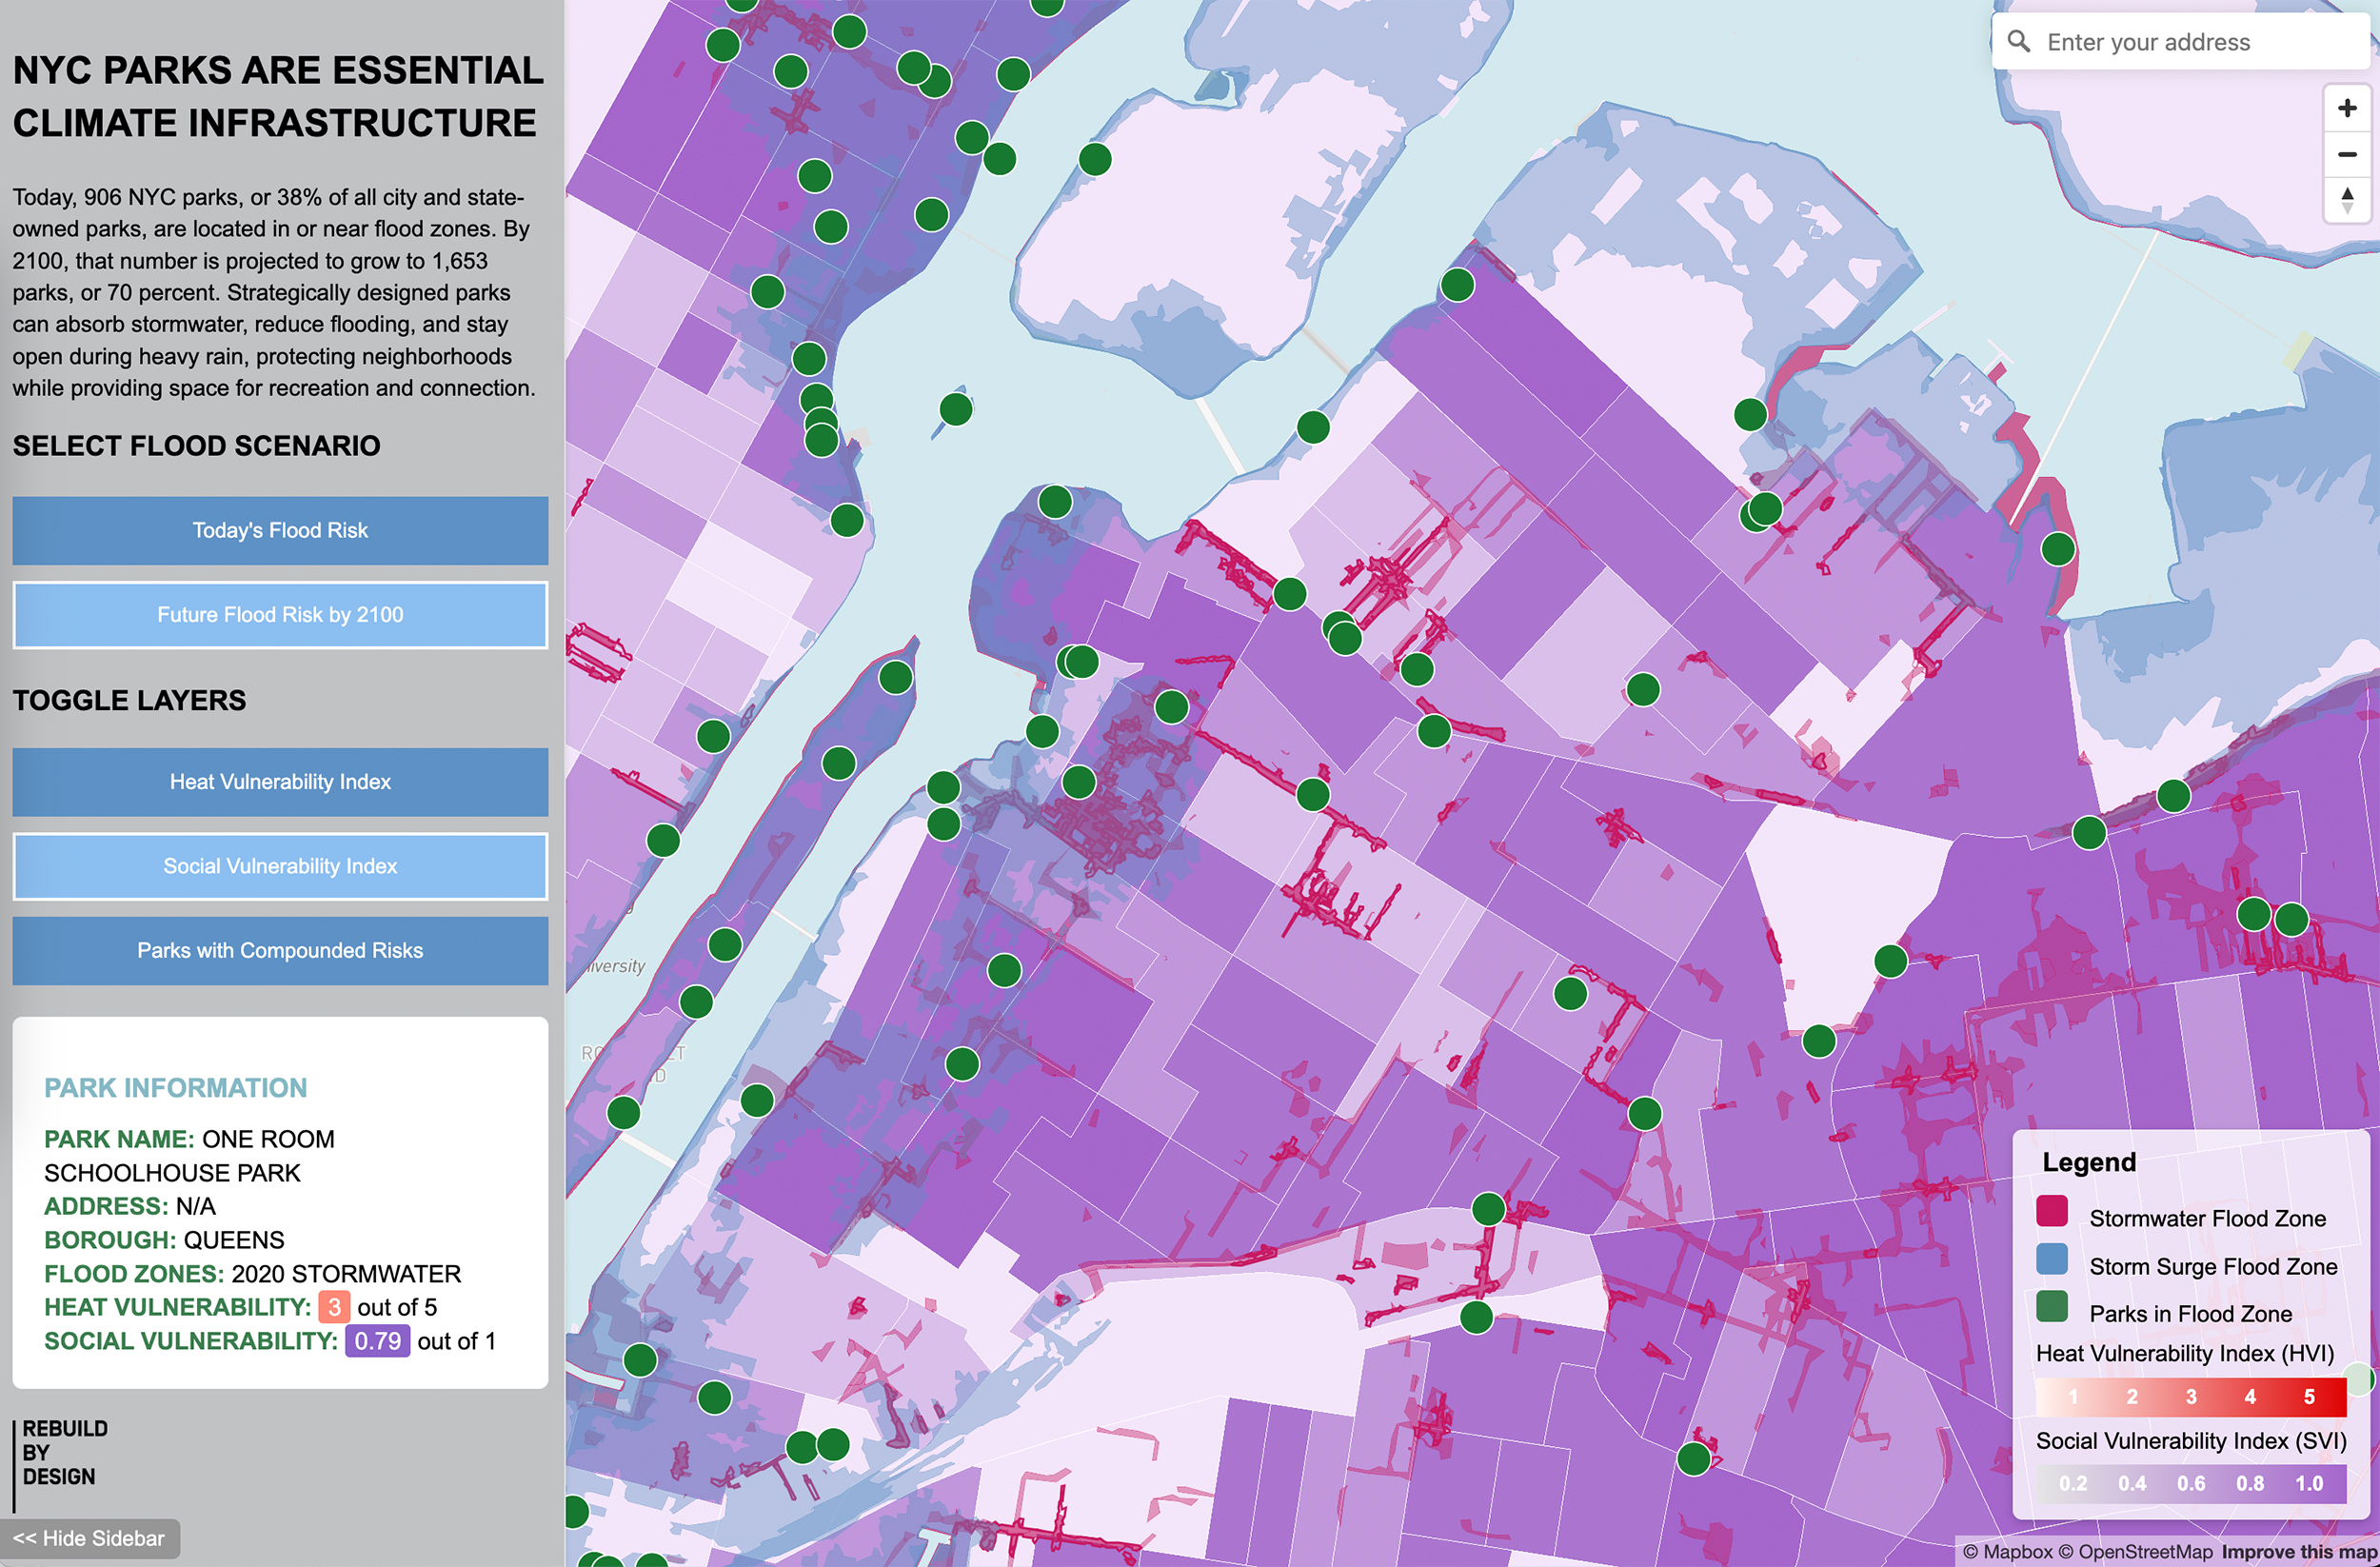
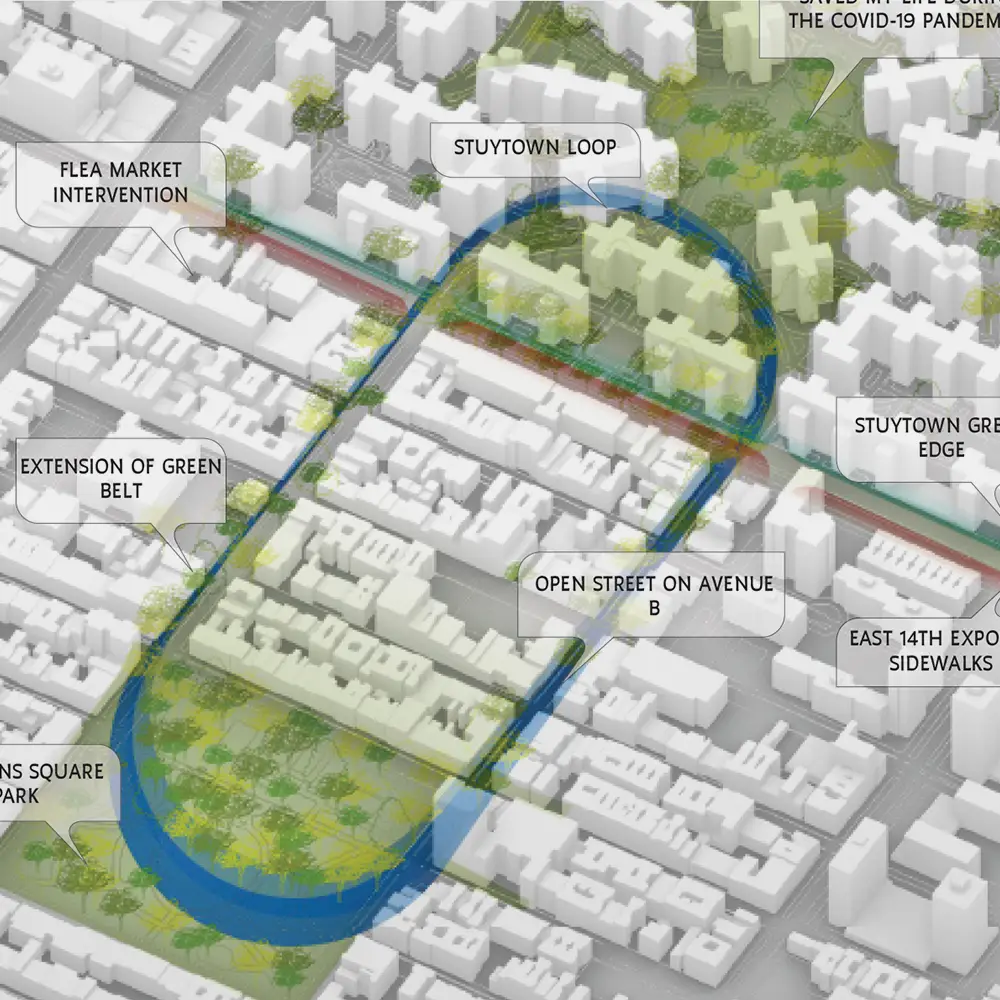
Developed an interactive map and report that reveals how many NYC parks are currently in, or will be in, flood zones and heat risk areas by 2100. The tool identifies high-priority parks in need of climate upgrades and provides city officials, advocates, and planners with evidence to unlock federal and state funding for parks-as-infrastructure. The analysis also offers clear recommendations for reimagining parks as stormwater management systems, cooling hubs, and community resilience centers.
Workflow
- Data Wrangling: Analyzed 2,385 city and state-owned parks using TPL’s ParkServe dataset and city open data
- Spatial Analysis: Used QGIS to map parks in or near current and projected stormwater and storm surge flood zones for 2020, 2050, and 2100, applying 100-foot buffers
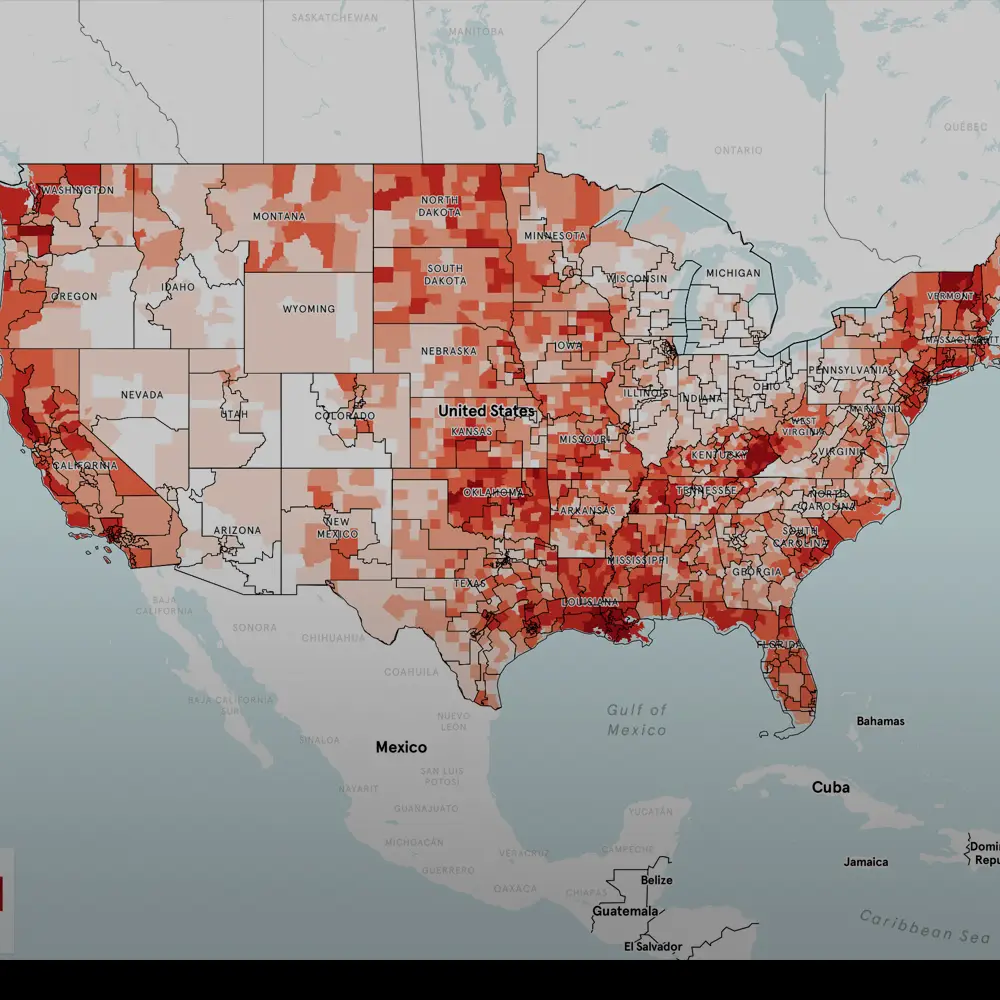
- Risk Assessment: Integrated Social Vulnerability Index (CDC) and Heat Vulnerability Index (DOHMH) to flag parks with compounded risks
- Interactive Mapping: Built an interactive tool for users to explore park risk scenarios, toggle layers, and view high-priority locations
- Report Writing: Synthesized findings into a visual, accessible report with actionable policy recommendations
- Case Study Integration: Showcased Hoboken’s ResilienCity Park as a replicable blueprint for NYC.
Tools & Skills
Mapbox GL JS · QGIS · ArcGIS · GeoJSON · Python/R · Visual Studio Code · Data Wrangling · Project Management · UX/UI Design
Impact
- Revealed that 70% of NYC parks will be in flood zones by 2100, up from 38% today
- Identified and spotlighted the Bronx as home to 60% of NYC’s 177 highest-priority parks for climate adaptation, informing city and borough strategies
- Led a walking tour of Hoboken’s ResilienCity Parks to demonstrate real-world infrastructure success—showcasing how post-Sandy investments now reduce urban flooding by 88% to over 50+ park advocates and organizations.
- Featured in the following media outlets:
- April 5, 2025 – NY1: A new solution to street flooding? Hoboken could be the model
- April 28, 2025 – Fast Company: Hoboken’s parks were redesigned to stop floods. Could New York City’s be next?