Flood risk to people, public infrastructure and the economy, in every New Jersey town
01
Objective
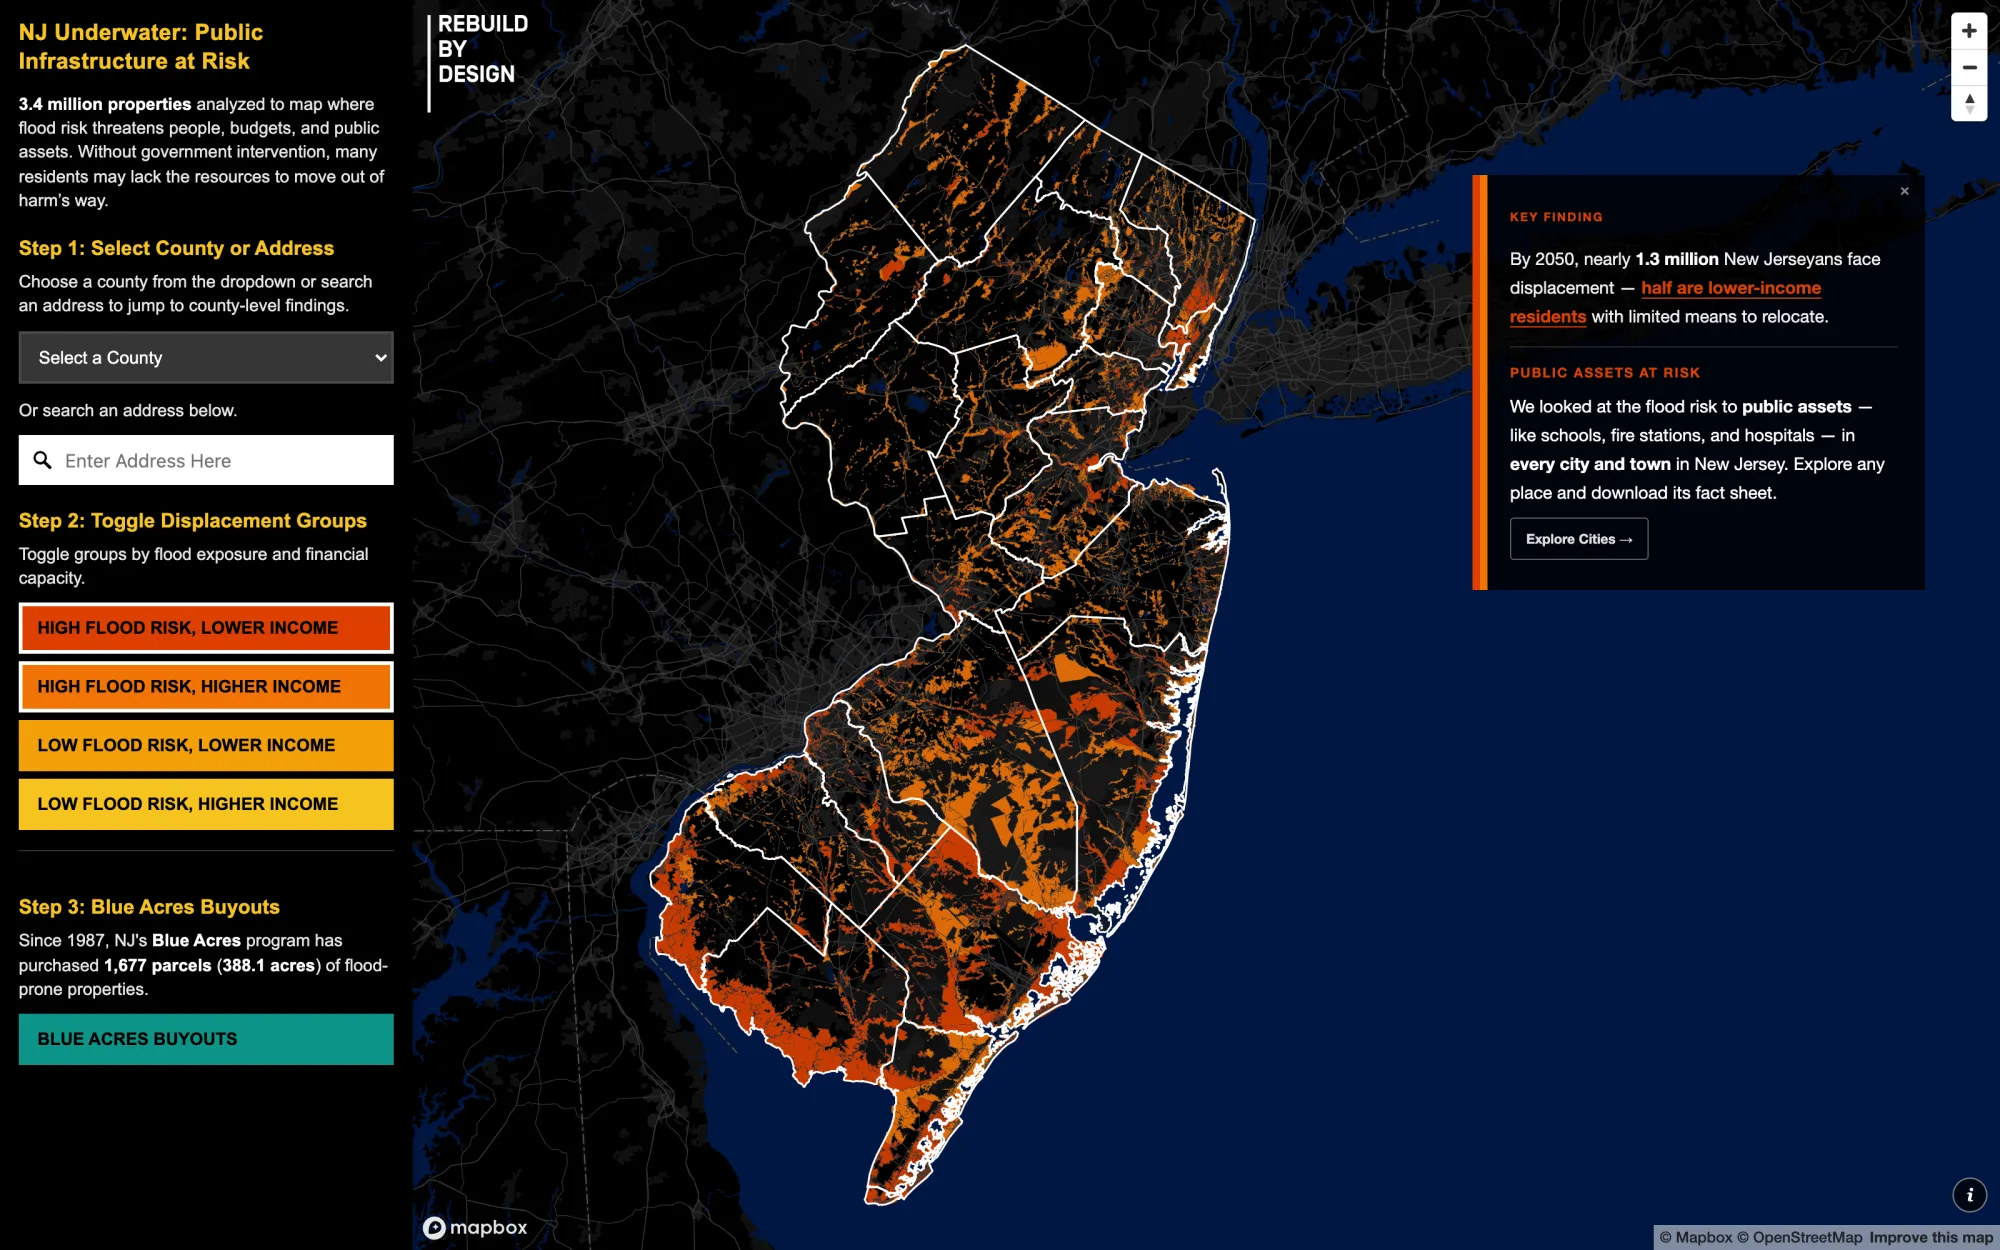
Show New Jerseyans what flooding puts at risk in their own town: the neighbours who may be forced to move, the schools, hospitals and fire stations they depend on, and the tax dollars that pay for them. Then let anyone look up their town and download the findings.
02
Challenge
Flooding in New Jersey is getting worse, and the costs land on families through rising property taxes, higher insurance premiums and growing utility bills. When residents leave, they take their tax dollars with them, the dollars that fund the schools, water systems and emergency services everyone who stays still relies on.
The data to see this already existed, spread across FEMA, state tax records, the Census and a dozen state agencies, in no form a resident or a mayor could use.
03
Solution
Two interactive maps and a fact sheet for every county and municipality, released in three stages:
- 2025, Flood Risk = Financial Risk: all 3.4 million New Jersey properties classified with Milliman, showing who lives in high flood risk areas and who can afford to move.
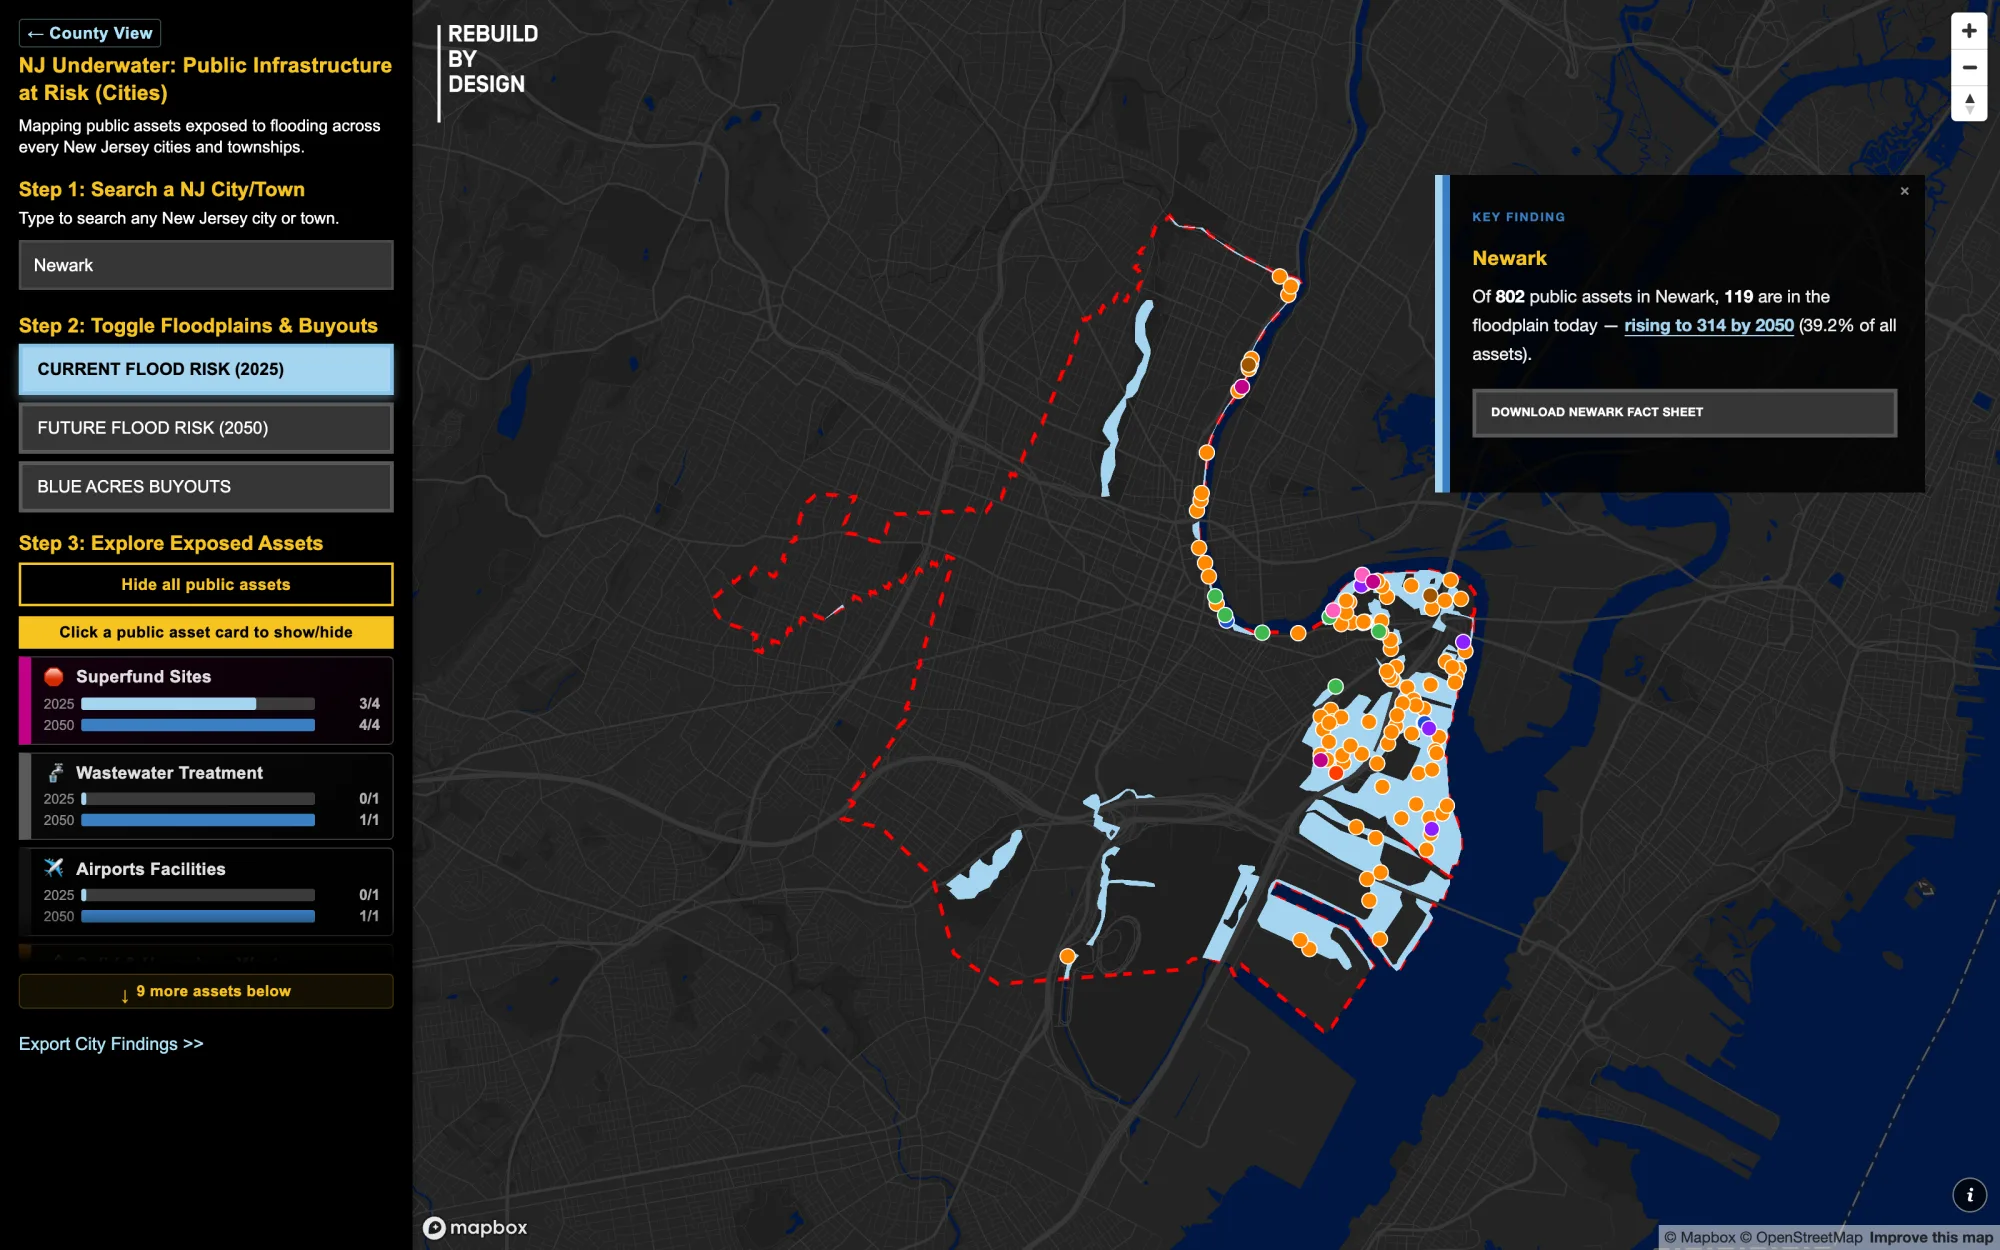
- April 2026, NJ Underwater: 18,959 public assets across 13 types mapped against 2025 and 2050 flood risk, for all 21 counties and eight cities.
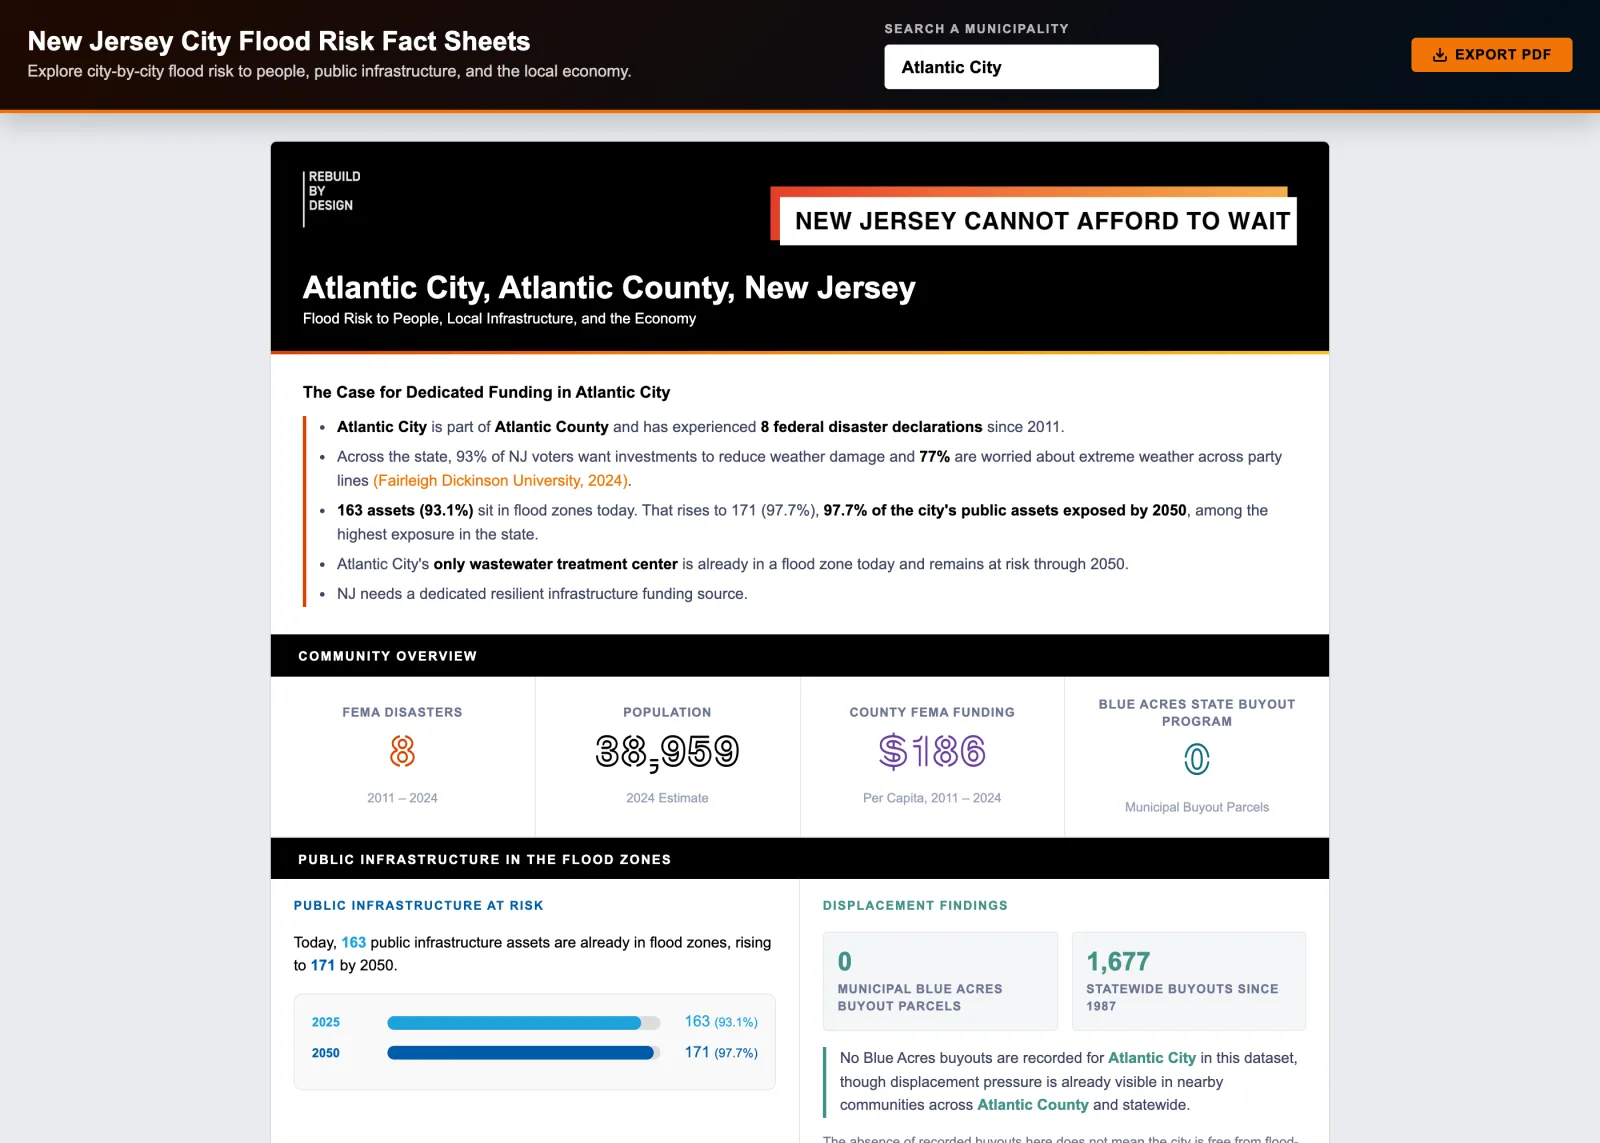
- July 2026: expanded to all 564 municipalities. Anyone can enter an address or a town and download its fact sheet.
Explore the county map →
Explore the city and town map →
County fact sheets →
City and town fact sheets →
04
Workflow
- Data engineering: cleaned and joined property, tax, Census and flood data for 3.4 million parcels in Python, R and QGIS. High flood risk means at least half a parcel is inundated, using the Rutgers NJ Design Flood Elevation for 2025 and 2050
- Displacement: sorted residents into four groups by flood risk and income, using the HUD lower income limit, and mapped 1,677 Blue Acres buyouts since 1987
- Public assets: overlaid 18,959 schools, hospitals, fire and police stations, wastewater plants, power plants, parks, contaminated sites and more on 2025 and 2050 flood risk
- Visualization: built both maps in Mapbox GL JS with address search, plus a fact sheet for every county and municipality with PDF export
- Checks: matched every number in the maps against the data tables and GIS exports before each release
- Collaboration: worked with Milliman, Rutgers and the Rebuild by Design team on review, press and outreach
05
Tools & Skills
QGIS · Mapbox GL JS · JavaScript · Python/R · Data Wrangling · Report Writing · Policy Analysis · UX/UI Design · Project Management
06
What it found
- Nearly 1 in 4 public assets in New Jersey sit in flood risk areas today. By 2050, more than 1 in 3, from 4,348 to 6,726.
- Schools see the fastest growth: 196 in flood zones today, 524 by 2050.
- By 2050, 35 municipalities will have every one of their public assets in flood risk areas, and 155 will have at least half.
- By 2050, 1.3 million New Jerseyans will live in high flood risk areas. Half are lower income.
- $435.9 billion in property value and $5.9 billion a year in property tax revenue are at risk by 2050.
07
Where it went
- Presented at the NJ Climate Change Research Symposium, Rutgers, 10 June 2026
- April 2026: CBS News, Analysis shows flood zones threatening N.J. public infrastructure; News 12, New flood analysis finds 1 in 4 NJ public buildings in flood zones; Press of Atlantic City, 98% of schools, fire and police stations, hospital in Atlantic City at flood risk by 2050; Asbury Park Press, Jersey Shore flooding expected to move this farther inland by 2050; Hudson Reporter, Flood Risk Threatens Hundreds Of Jersey City Public Assets; Patch, These Jersey Shore Communities Could Be Underwater By 2050
- May to June 2025: PBS, Increased flooding could lead to ‘climate migration’ in NJ; Press of Atlantic City, Cape May, Atlantic counties have highest flood damage risk in New Jersey over next 25 years; Cape May County Herald, Report: 70% of County Property at Flooding Risk by 2050; Patch, More Than 1M NJ Residents Live Under High Flood Risk, New Report Says