New Yorkers’ flood stories, on the record next to the city’s own data
01
Objective
Document where New Yorkers actually experience flooding, and put their stories on the same map as the official record, so elected officials and city agencies have proof they cannot ignore.
02
Challenge
New Yorkers have made more than 113,000 flood reports to 311 since Hurricane Ida, and official data still only capture a portion of what happens. City flood maps do not show every place it floods. A puddle in a hallway, a basement that fills every storm, a neighbour’s belongings on the curb the morning after: none of that is in a dataset.
Collecting it meant building something new: a public map that takes in stories, photos, video and voice notes from residents, keeps them private where they ask, and gets every one reviewed before it goes live.
03
Solution
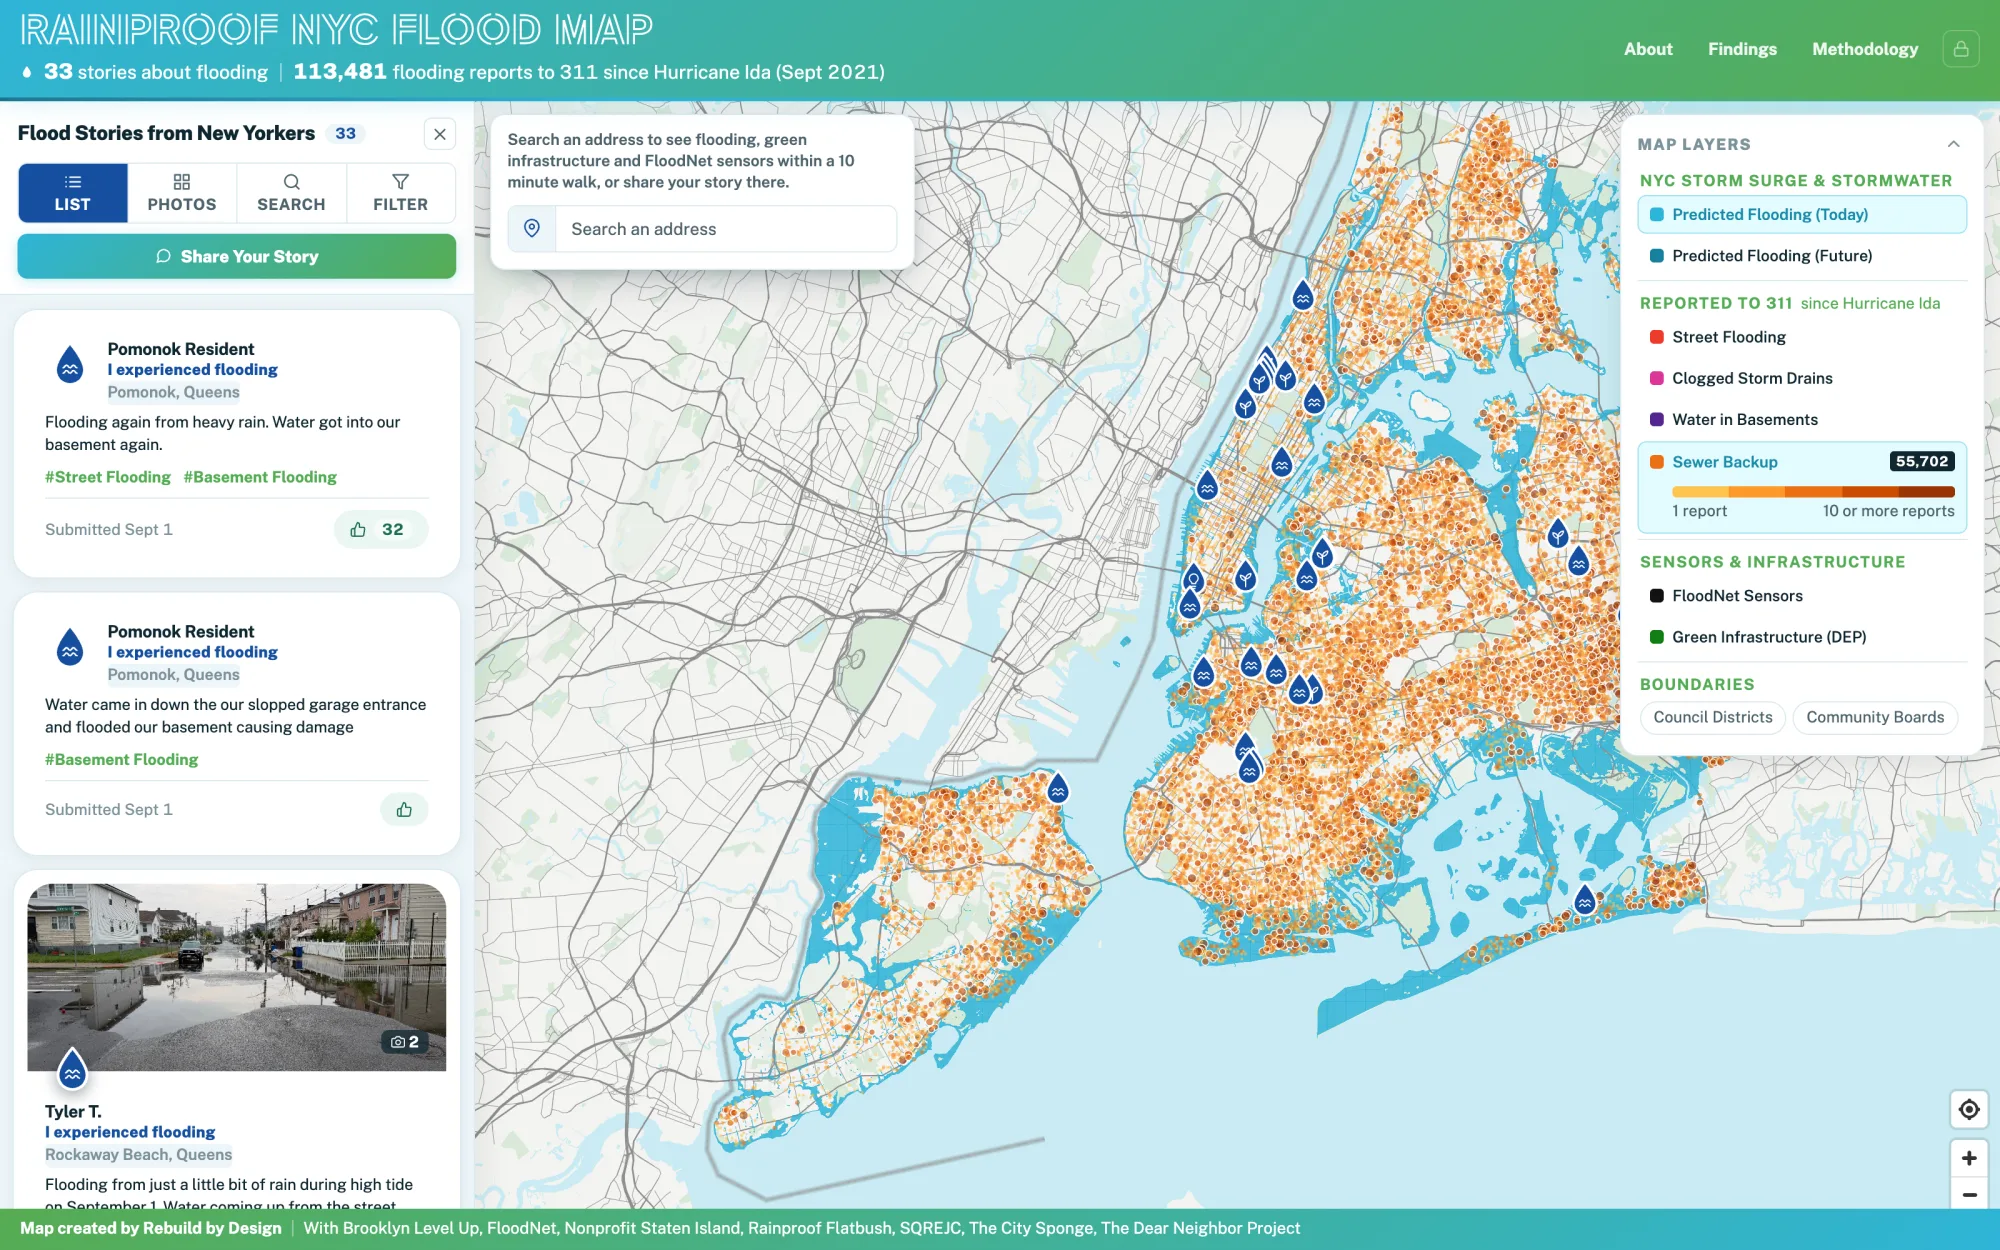
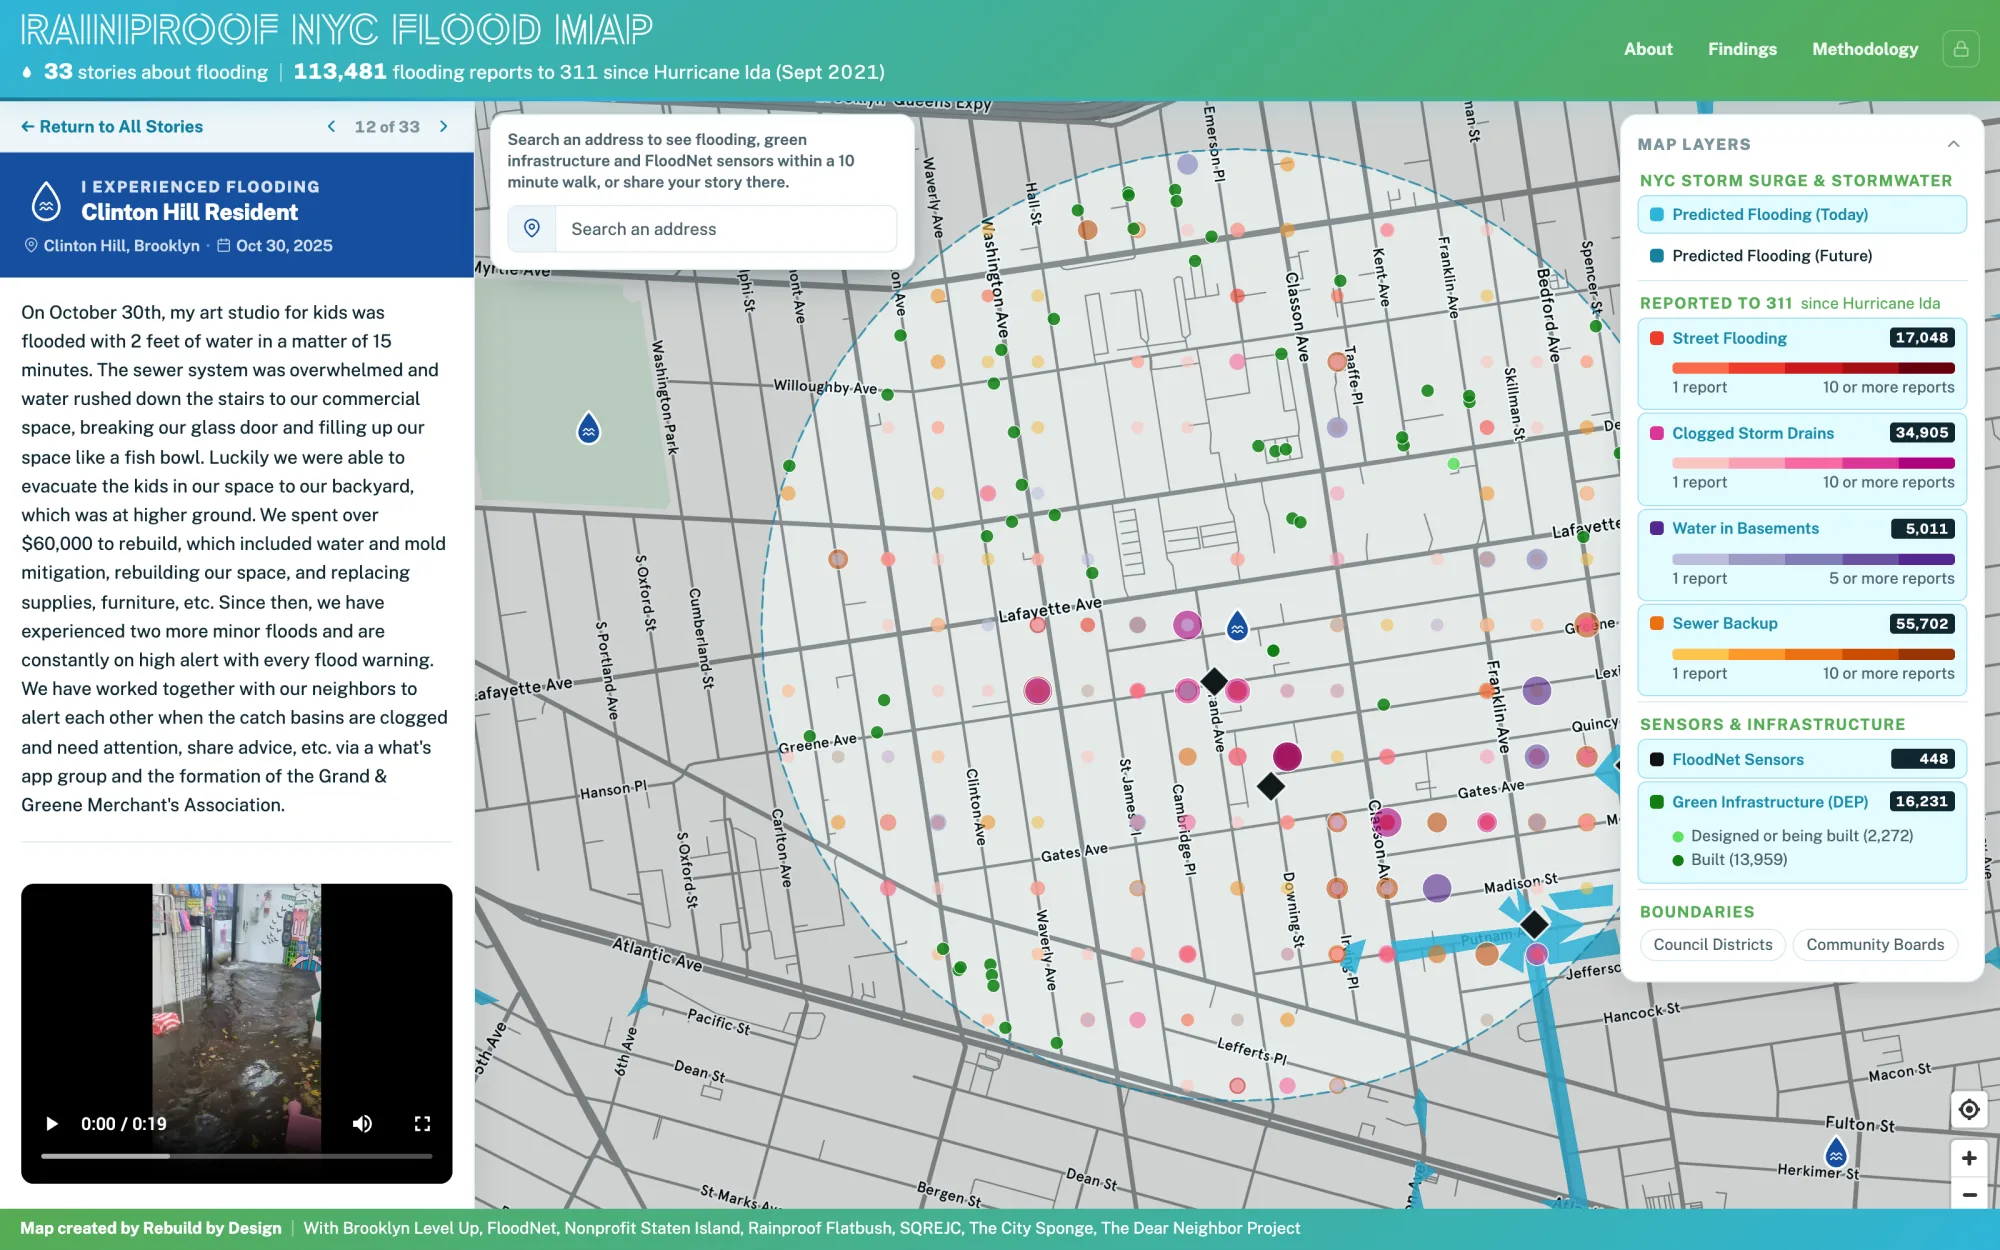
The Rainproof NYC Flood Map. Residents drop a pin and share a flooding experience, an action their community took, or an idea for what should happen next, with photos, video or audio. Each story sits on top of 311 flood reports since Hurricane Ida, FloodNet sensors, DEP green infrastructure and the city’s stormwater flood projections. Click anywhere, or search an address, to see what has happened within a 10 minute walk.
Built with the Rainproof Your Community partners: Brooklyn Level Up, FloodNet, Nonprofit Staten Island, Rainproof Flatbush, SQREJC, The City Sponge and The Dear Neighbor Project.
04
Workflow
My first mapping project with a database behind it, planned and shipped through more than 140 issues in Linear.
- Database: Supabase (Postgres, storage and auth) with row level security, submissions through an Edge Function behind a bot check
- Media: photos and video compressed, thumbnailed and stripped of location data in the browser before upload; voice notes recorded in the form
- Privacy: every pin generalized to about a block and the exact location never kept; residents choose how their name appears; a retention rule that actually runs
- Moderation: an admin console where every story is reviewed before it is published, email alerts when one arrives, and a one page moderation standard for staff
- City data: 311, FloodNet and DEP layers rebuilt weekly by a GitHub Action and served as frozen files, each with its build date
- Testing: two feedback rounds, including nine practitioners, then every control checked across twelve screen sizes, touch and keyboard
05
Tools & Skills
Mapbox GL JS · JavaScript · Supabase / PostgreSQL · GitHub Actions · NYC Open Data API · Cloudflare Turnstile · UX/UI Design · Privacy & Moderation Design · Project Management
06
What it found
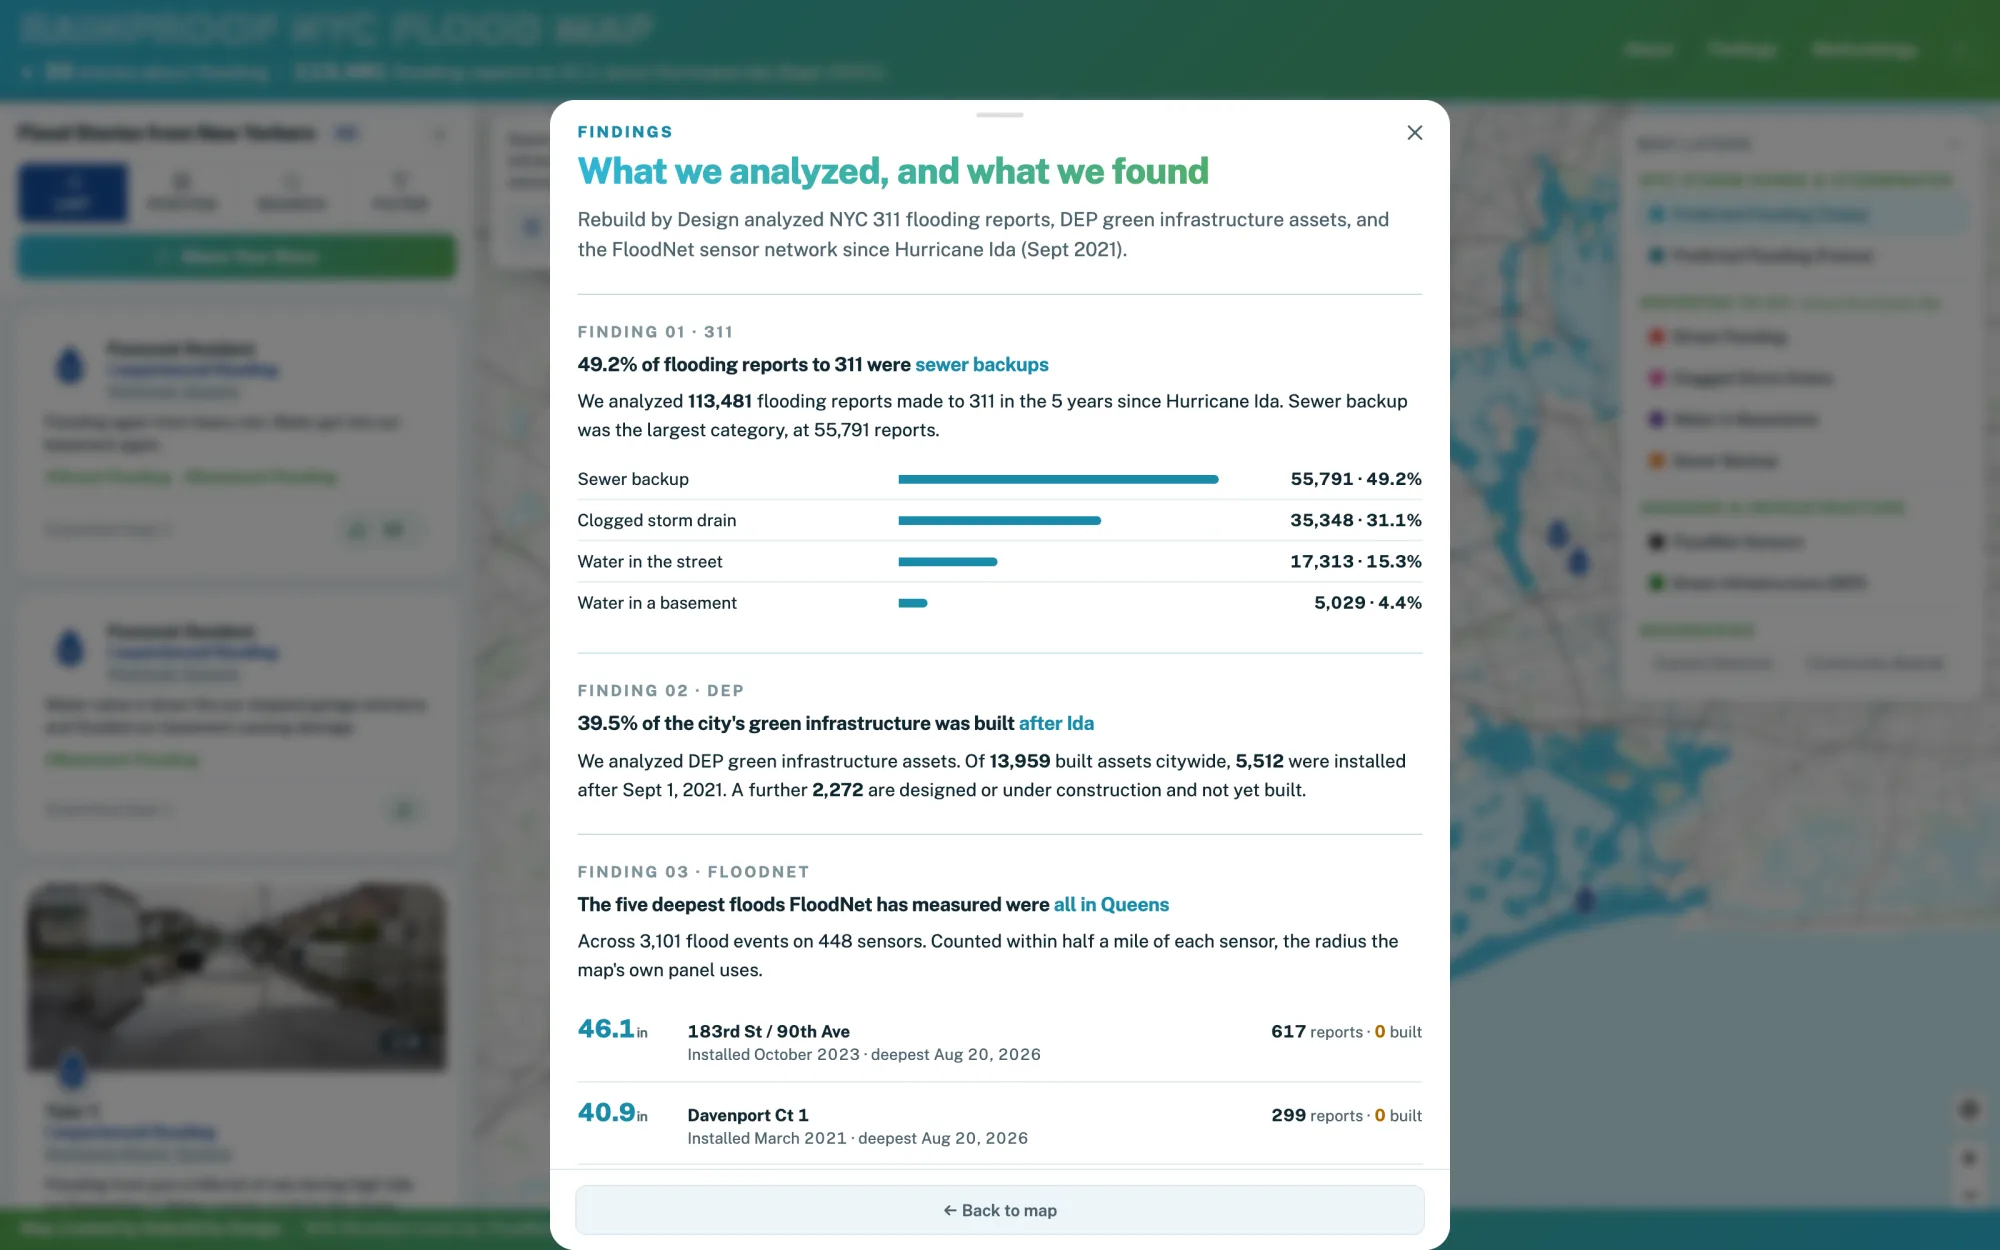
- New Yorkers made 113,481 flood reports to 311 in the five years since Hurricane Ida.
- Nearly half, 55,791 (49.2%), were sewer backups, followed by clogged storm drains, water in the street and water in basements.
- Staten Island has 25 times more reports per 1,000 residents.
- Queens Community Board 12 has had 7,250 flood reports, the most of any board in the city.
- The deepest water recorded by FloodNet was 46.1 inches, at 183rd St and 90th Ave in Queens on 20 May 2026.
07
Where it went
- Launched 26 August 2026, days before the fifth anniversary of Hurricane Ida, with a newsletter to more than 1,000 people and a press briefing featuring New Yorkers directly affected by flooding
- 33 stories shared by residents across the city by September 2026