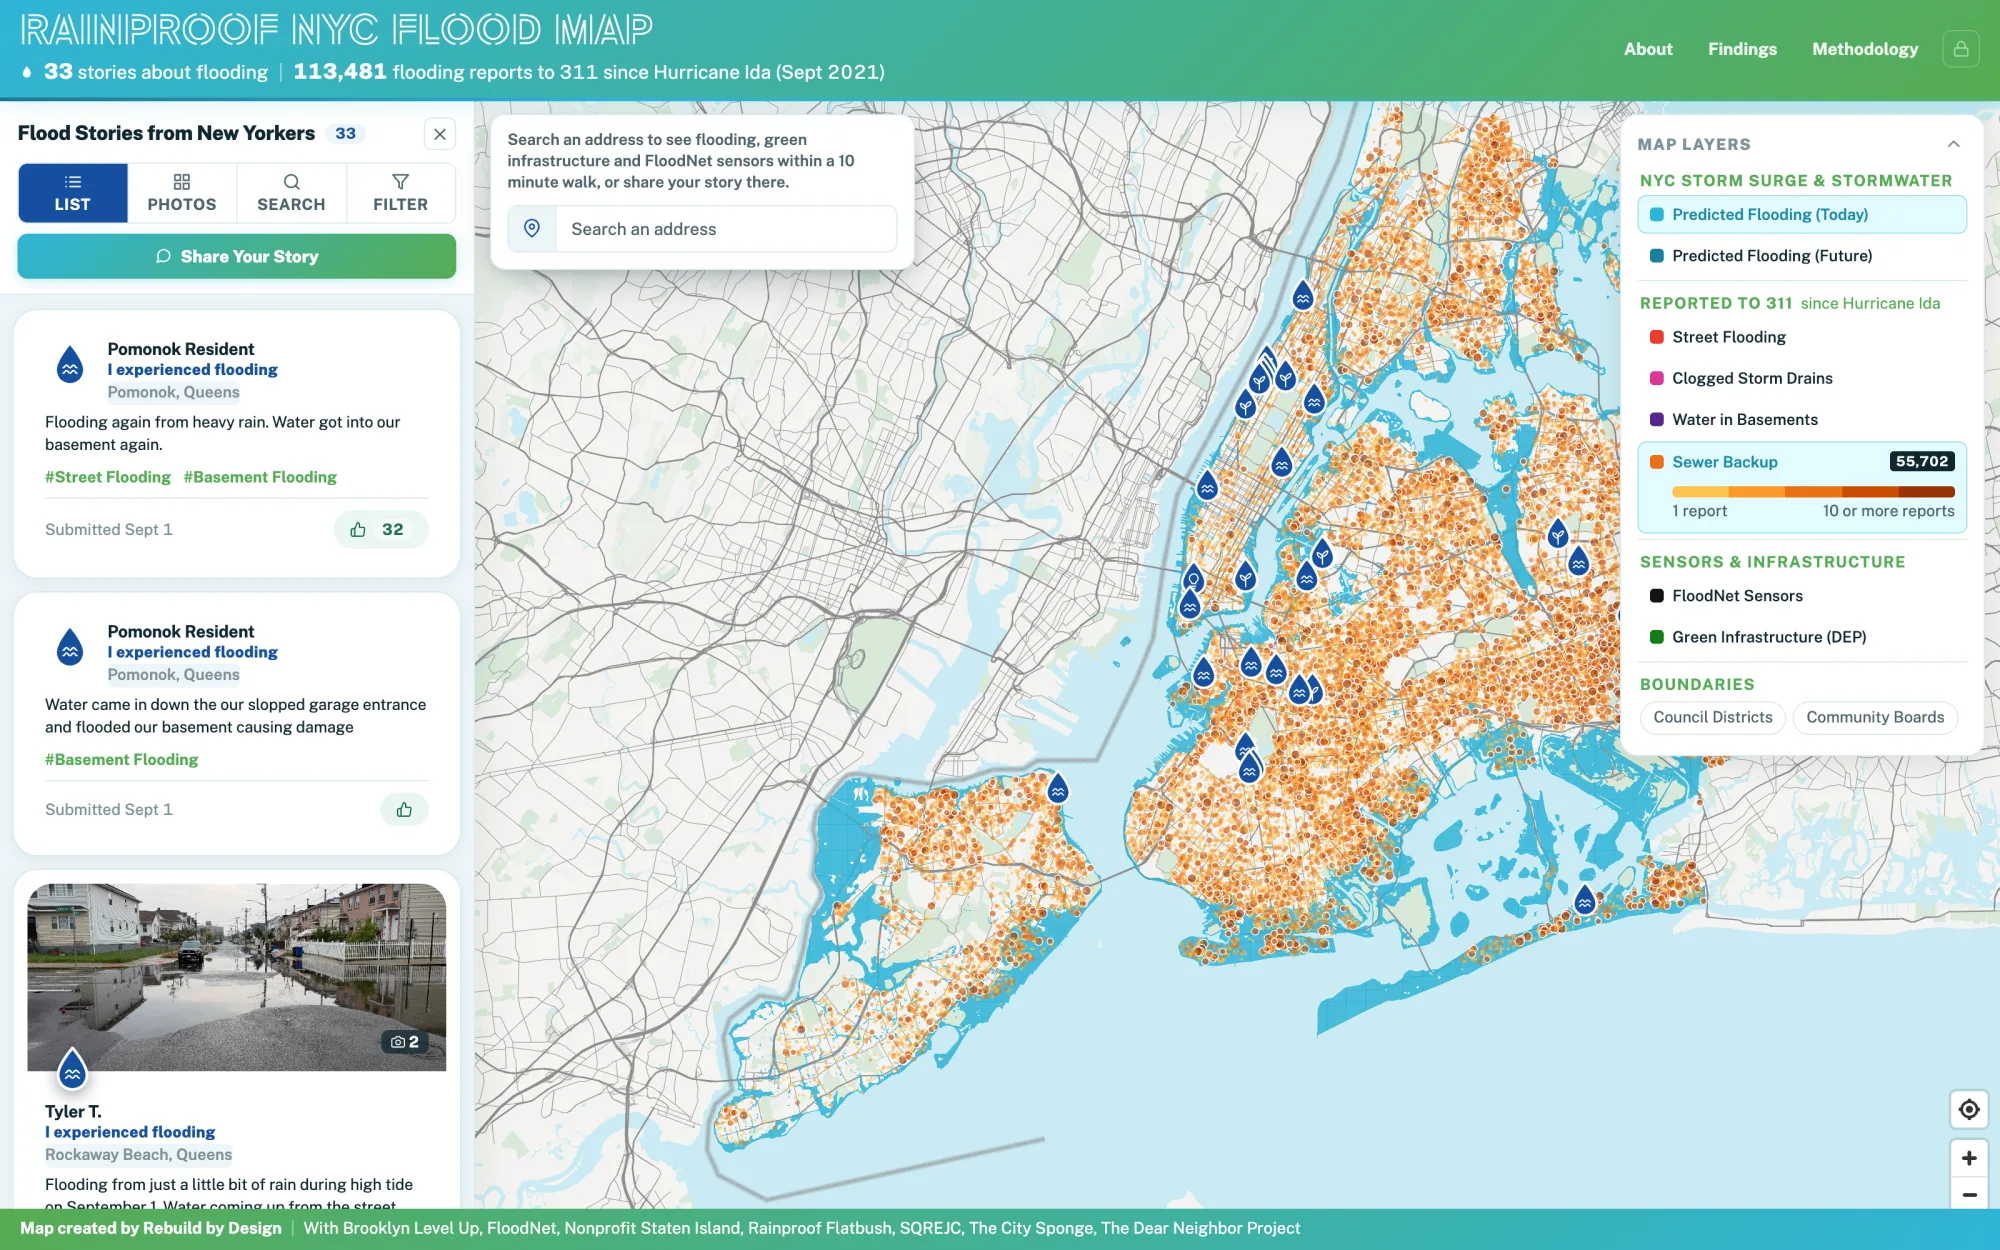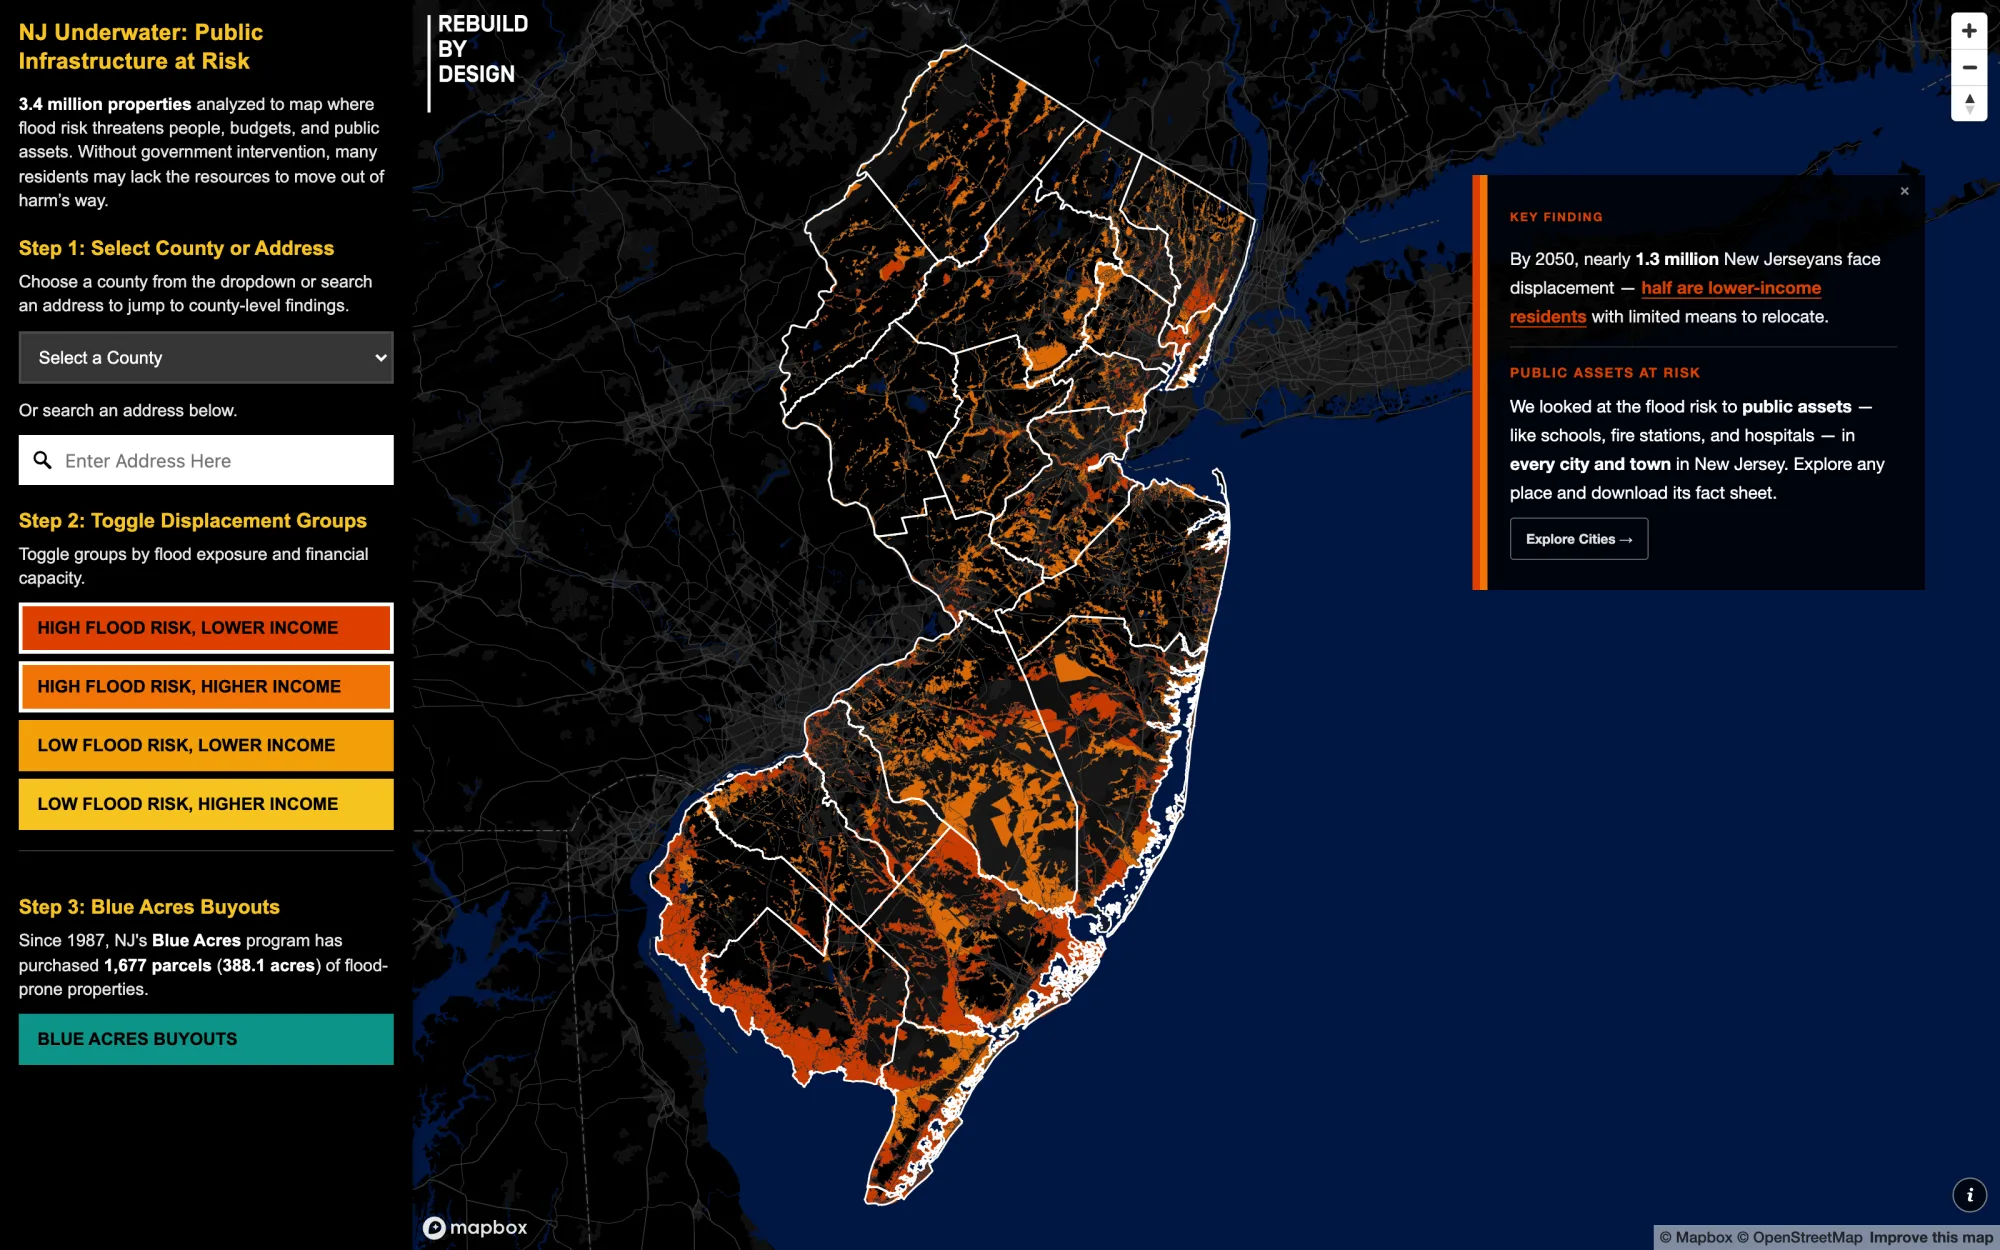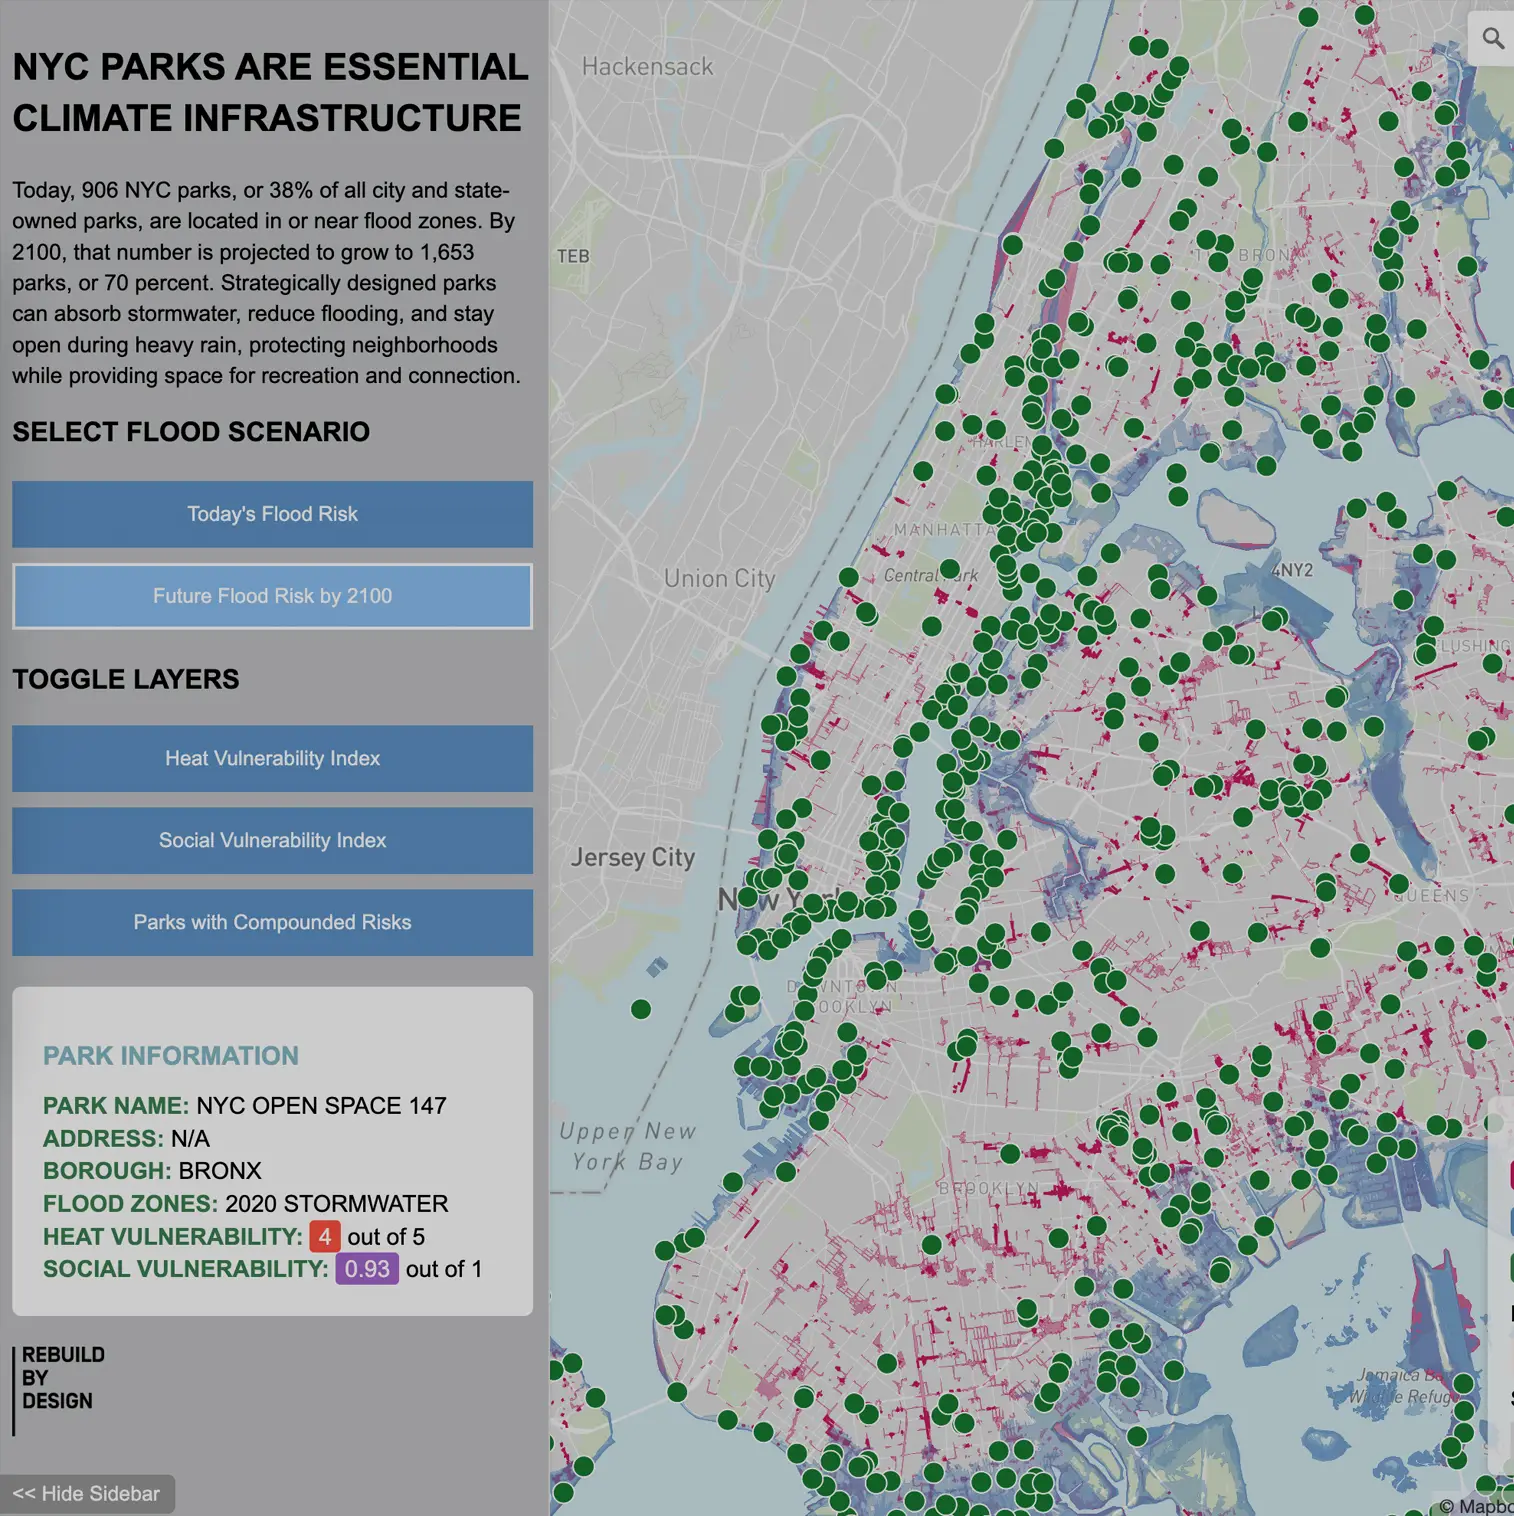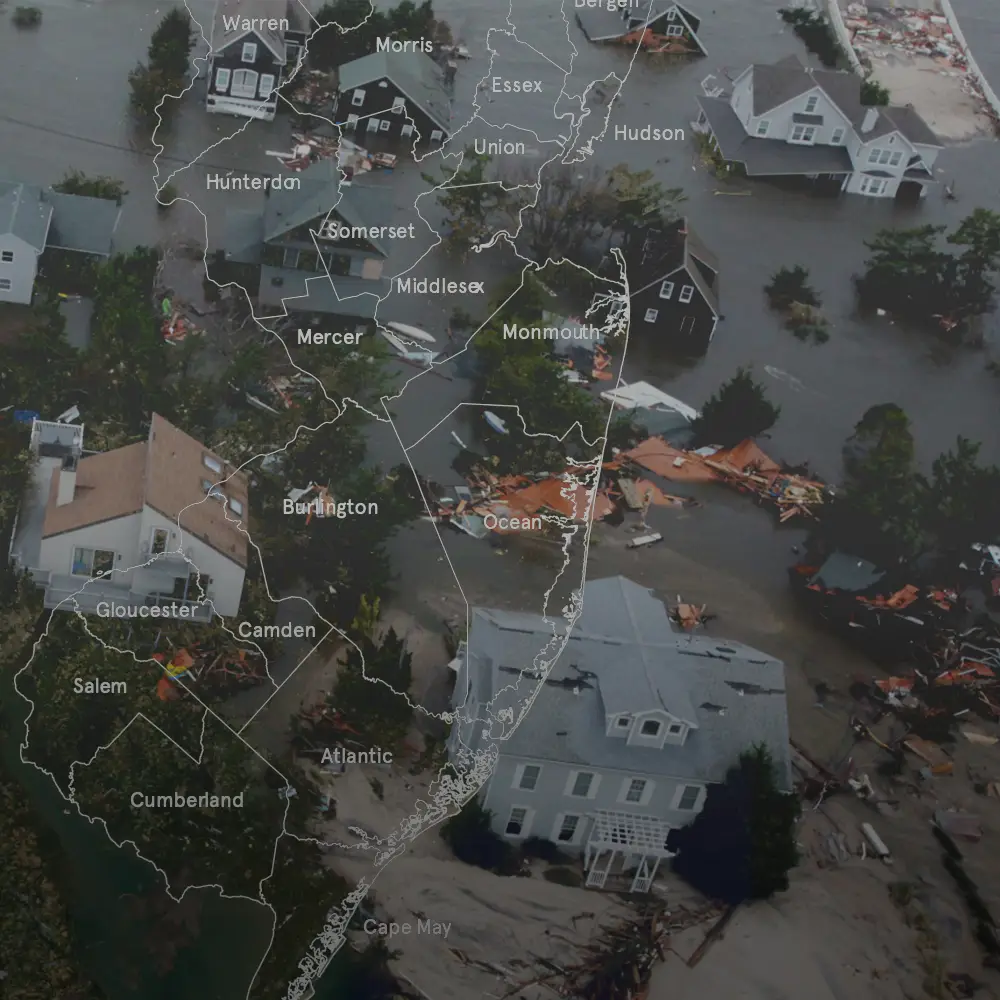
State reports on federal disasters and what recovery cost, by county and by legislative district
My roleLed the GIS, data analysis, design and report building, and co-wrote the reports
WhenSince spring 2023, Vermont edition out in August 2023
WithRebuild by Design, with local partners and coalitions in each state
ScaleStarted with New Jersey, Vermont and Massachusetts, the same method now covers eight states
Run asSix Vermont drafts in two weeks, three rounds of review
01
The question
Does my state have its own money set aside for the next disaster? In New Jersey, Vermont and Massachusetts, the answer was no. The same places get hit again and again, and each time the state pays to recover. The records are public, in FEMA databases and long state reports, but they are hard for a legislator or a local advocate to use. The state reports put every major disaster declaration into the districts lawmakers represent, so a legislator can open one report and find their own, with what recovery cost.
I also asked for a “call to action to the doom and gloom” at the end. After pages of disasters, a reader should finish on what their state could do.
02
The hard part
Vermont was the one that had to go out fast, and we had about two weeks. In July 2023, two days of rain flooded towns across the state and damaged more than 4,000 homes. Our first Vermont draft is dated 20 July, and the report was out in early August. The FEMA data behind the maps ran to 2021, so the report had to say plainly that Vermont was still being hit while we were writing it.
Massachusetts had its own problems. In Vermont we could skip congressional districts, because the whole state is one district, but Massachusetts has several. Its state house table ran to 160 rows, and I could not find congressional district data to start from.
What brokeIn the fourth Vermont draft, district tables still added up every county’s disasters, so one storm hitting two counties counted twice. I broke every district back into its counties, and the Atlas now counts each disaster once per place.
03
How I ran it
Vermont and Massachusetts each went through the same loop: draft, review with colleagues and partners, fix, and draft again, until the numbers and the maps held up.
- Spring 2023New Jersey, my first state packetI picked up the Atlas of Disaster: New Jersey packet and made my first draft of it in April 2023, with more drafts in May and July.
- July to August 2023Vermont, right after the floodsSix drafts in about two weeks, with three rounds of review from colleagues and partners. Out in early August, and covered by Seven Days on 3 August. The final Vermont InDesign file became the template for the Massachusetts report.
- November 2023 to August 2024Massachusetts and New JerseyFirst Massachusetts draft in November 2023, built from the Vermont template. New Jersey drafts through April 2024, plus a 22 by 28 inch poster of the state’s legislative districts in August 2024.
- Late 2024 to mid 2025Update to 2024, and redraw the main maps in houseRefreshed the data through 2024 and re-issued Vermont in March 2025. The first editions used maps from a partner firm. In the updated edition, the main county maps are made by Rebuild by Design. Massachusetts and Connecticut went through new drafts in 2025.
- 2026West Virginia and AppalachiaWorked on the West Virginia edition in early 2026. In July I used the Atlas county data for an interactive map of all 423 counties in the Appalachian Region.

I showed each lawmaker their district with its counties counted separately, because one storm often hits several counties and would be counted twice.
04
What I built
A printed report for each state. The Vermont one runs 35 pages. It has eight maps: where disasters hit, where federal recovery money went, where people have the hardest time recovering (social vulnerability), and which utility areas lose power most. It has a timeline of every declaration, matched with local news from the time, and tables of disasters by state house and state senate district. Each report ends with ways the state could raise its own money for adaptation, such as a small insurance surcharge or a climate superfund law. New York’s $4.2 billion Environmental Bond Act was one model.
Read the Atlas of Disaster: Vermont →
QGIS · Python/R · Data Wrangling · Policy Research · Report Writing · Adobe Illustrator · Adobe InDesign · Stakeholder Engagement · Project Management
I listed district numbers instead of lawmakers’ names, because a reader can check numbers against the state’s own map.
I added a note that the ranking misses heat waves, because federal declarations follow physical damage and heat rarely gets one.
05
What it found
- New Jersey had 14 federal major disaster declarations from 2011 to 2023, and every one of its 21 counties had at least five.
- Those disasters cost U.S. taxpayers more than $7.2 billion, putting New Jersey third in the country for spending on climate disasters per person. New Jersey had no dedicated money of its own to prepare for the next one.
- A modest 2% surcharge on some lines of property and casualty insurance could support $9.1 billion in climate infrastructure in New Jersey over 10 years.
- Vermont received $580 million in FEMA and HUD recovery money from 2011 to 2024, about $902 per Vermonter, the fourth highest per person in the country. All 14 of its counties had five or more disasters.

06
Where it went next
- 3 August 2023: Seven Days Vermont, Report Catalogs Vermont’s Growing Litany of Disasters.
- 24 January 2024: the Vermont research and data were used in witness documents submitted to the Vermont Senate Economic Development Committee for Bill S.311.
- 5 August 2024: NJ Spotlight News, Federal disasters declared in NJ, 2011-2023.
- March 2025: the re-issued Vermont report thanks Joie Zhang and me by name for research and design on it.
- Colleagues use the state reports in strategy meetings with legislators and local partners in New Jersey, Vermont and Massachusetts. I am still the main data analyst for follow-up questions and new research.
- The same state method now also covers Connecticut, Kentucky, North Carolina, West Virginia and New York.
- July 2026: an interactive map of all 423 counties in the Appalachian Region, across 13 states, built on the Atlas county data.