How money spent protecting New York from floods can change who gets to live there
My roleResearched, designed and built it, as a John D. Solomon Fellow at NYC Emergency Management
WhenSeptember 2023 to May 2024; built in three weeks
WithNYC Emergency Management’s Risk Analysis and Recovery unit, and Chris Whong’s Advanced GIS class at NYU
Run asPitch, research, a three week build, four rounds of feedback, about 70 commits
ScaleFive neighborhood stories, each built from its own dataset
01
The question
When the city spends money to protect a neighborhood from flooding, who gets to stay there? A safer or nicer waterfront can raise rents and sale prices, and the people who lived through the floods can be the ones who get priced out. The map shows what that looks like in five New York neighborhoods, for city staff and for the public.
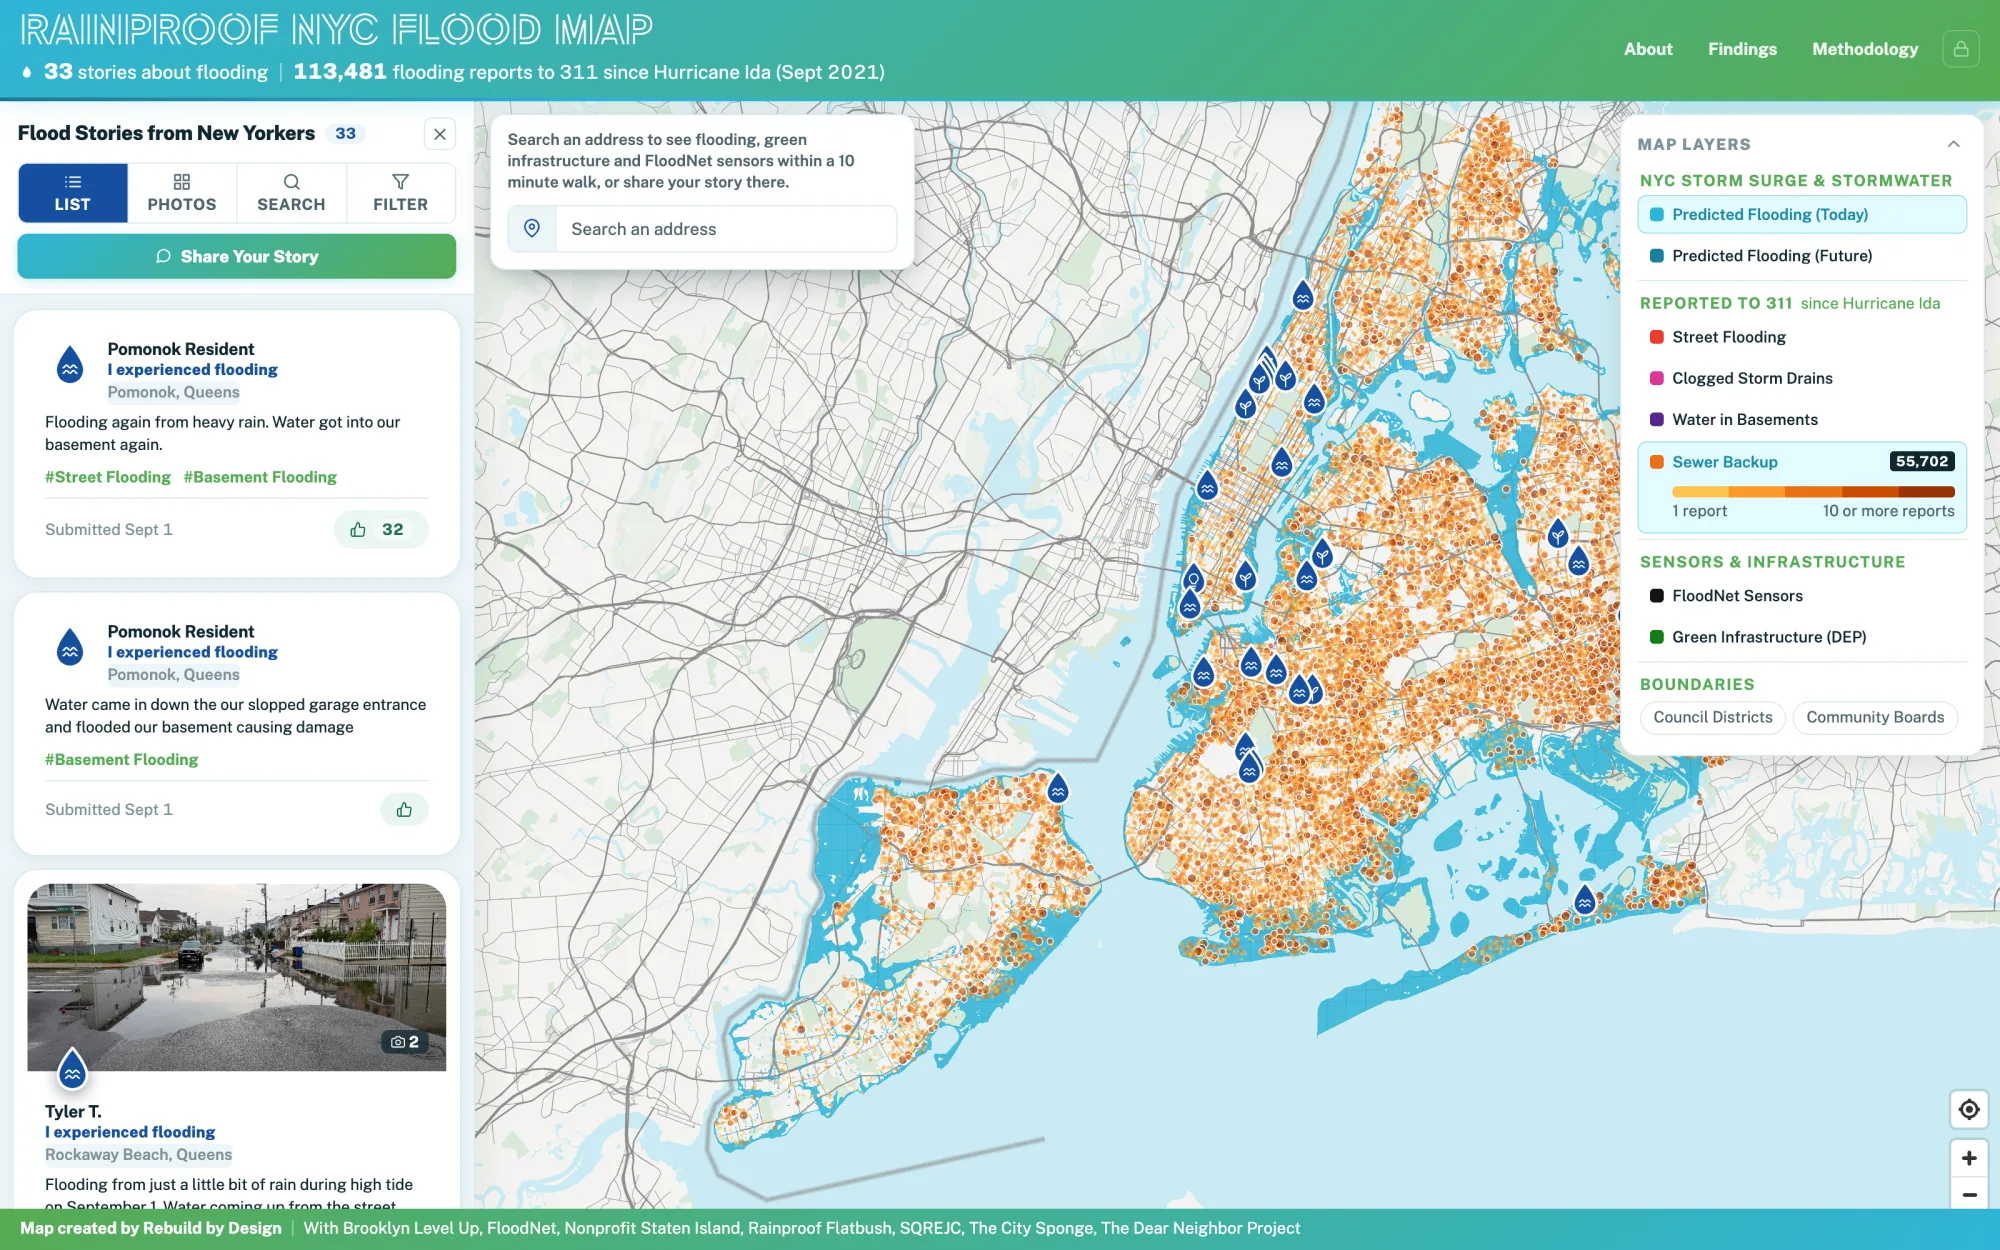
In my handoff to the team I listed ideas for future student projects at the agency. One was letting residents add their own hazard stories to the city’s hazard history tool. Rainproof NYC, which I built at Rebuild by Design two years later, lets residents do that for flooding.
02
The hard part
Climate gentrification does not look the same from place to place, and there is no single dataset for it. In Gowanus it follows a canal redevelopment. In Red Hook it shows up as new buildings on the waterfront after Hurricane Sandy. In the Rockaways it is about public housing, and on Staten Island it is about home sales and buyouts. Each story needed its own data, and I had to find a way to show them side by side without pretending they were one number.
The map was also two things at once: my project for NYC Emergency Management and my final project for Chris Whong’s Advanced GIS class at NYU, where I was learning the web mapping I built it with. The whole build fit into the last three weeks of the fellowship.
What brokeThe Red Hook lot layer would not work on the web map because it was in New York’s state plane coordinates. I re-exported it in longitude and latitude and the chapter could show zoning on each lot.
03
How I ran it
I lined the fellowship and the class up so one piece of work could serve both, then built fast and put it in front of reviewers early.
- September to December 2023Learn the team, then pitchJoined the Risk Analysis and Recovery unit on 13 September and worked on the city’s 2024 Hazard Mitigation Plan: I updated its profile of the city’s natural, social, built and future hazard setting, and resolved agency review comments on a tight deadline with my supervisors and legal review. In December I pitched two project ideas, and climate gentrification became the project.
- Early 2024Read and askReviewed the research on climate gentrification, talked it through with my two supervisors and two other advisers, and enrolled in Chris Whong’s class so the fellowship project and the class final could be the same map.
- 24 April to 1 MayBuildStarted the code on 24 April. Four days later the chapters were drafted through Staten Island, with custom markers for the Staten Island sales and a button so phone readers could switch between the story and the map.
- 27 April to 13 MayFour rounds of feedbackChris Whong and a classmate, then NYC Emergency Management, then my supervisor, then Chris Whong again. Each round went into the map the same day or the next.
- 13 and 14 MayFinish and hand offGraduated from the fellowship on 13 May. The next day I moved the whole map to the 2050s floodplain. I also left the team a write-up with links to the map, its data and its code.

I told five neighborhood stories instead of building one score, because each place shows climate gentrification differently and a score would hide how it happens.
04
What I built
A scrolling story map. As you read, the map moves through each place, starting with Gowanus, then Red Hook after Hurricane Sandy, the Red Hook Coastal Resilience project, public housing in the Rockaways, and home sales on Staten Island. You can click the boroughs to see who lives in the floodplain, click a home to see its sale, and hover over a hard term to get a plain definition.
It draws on the city’s sea level rise floodplains, MapPLUTO, Department of Finance property sales, Census population estimates, NYCHA public housing data and zoning.
Explore the map →
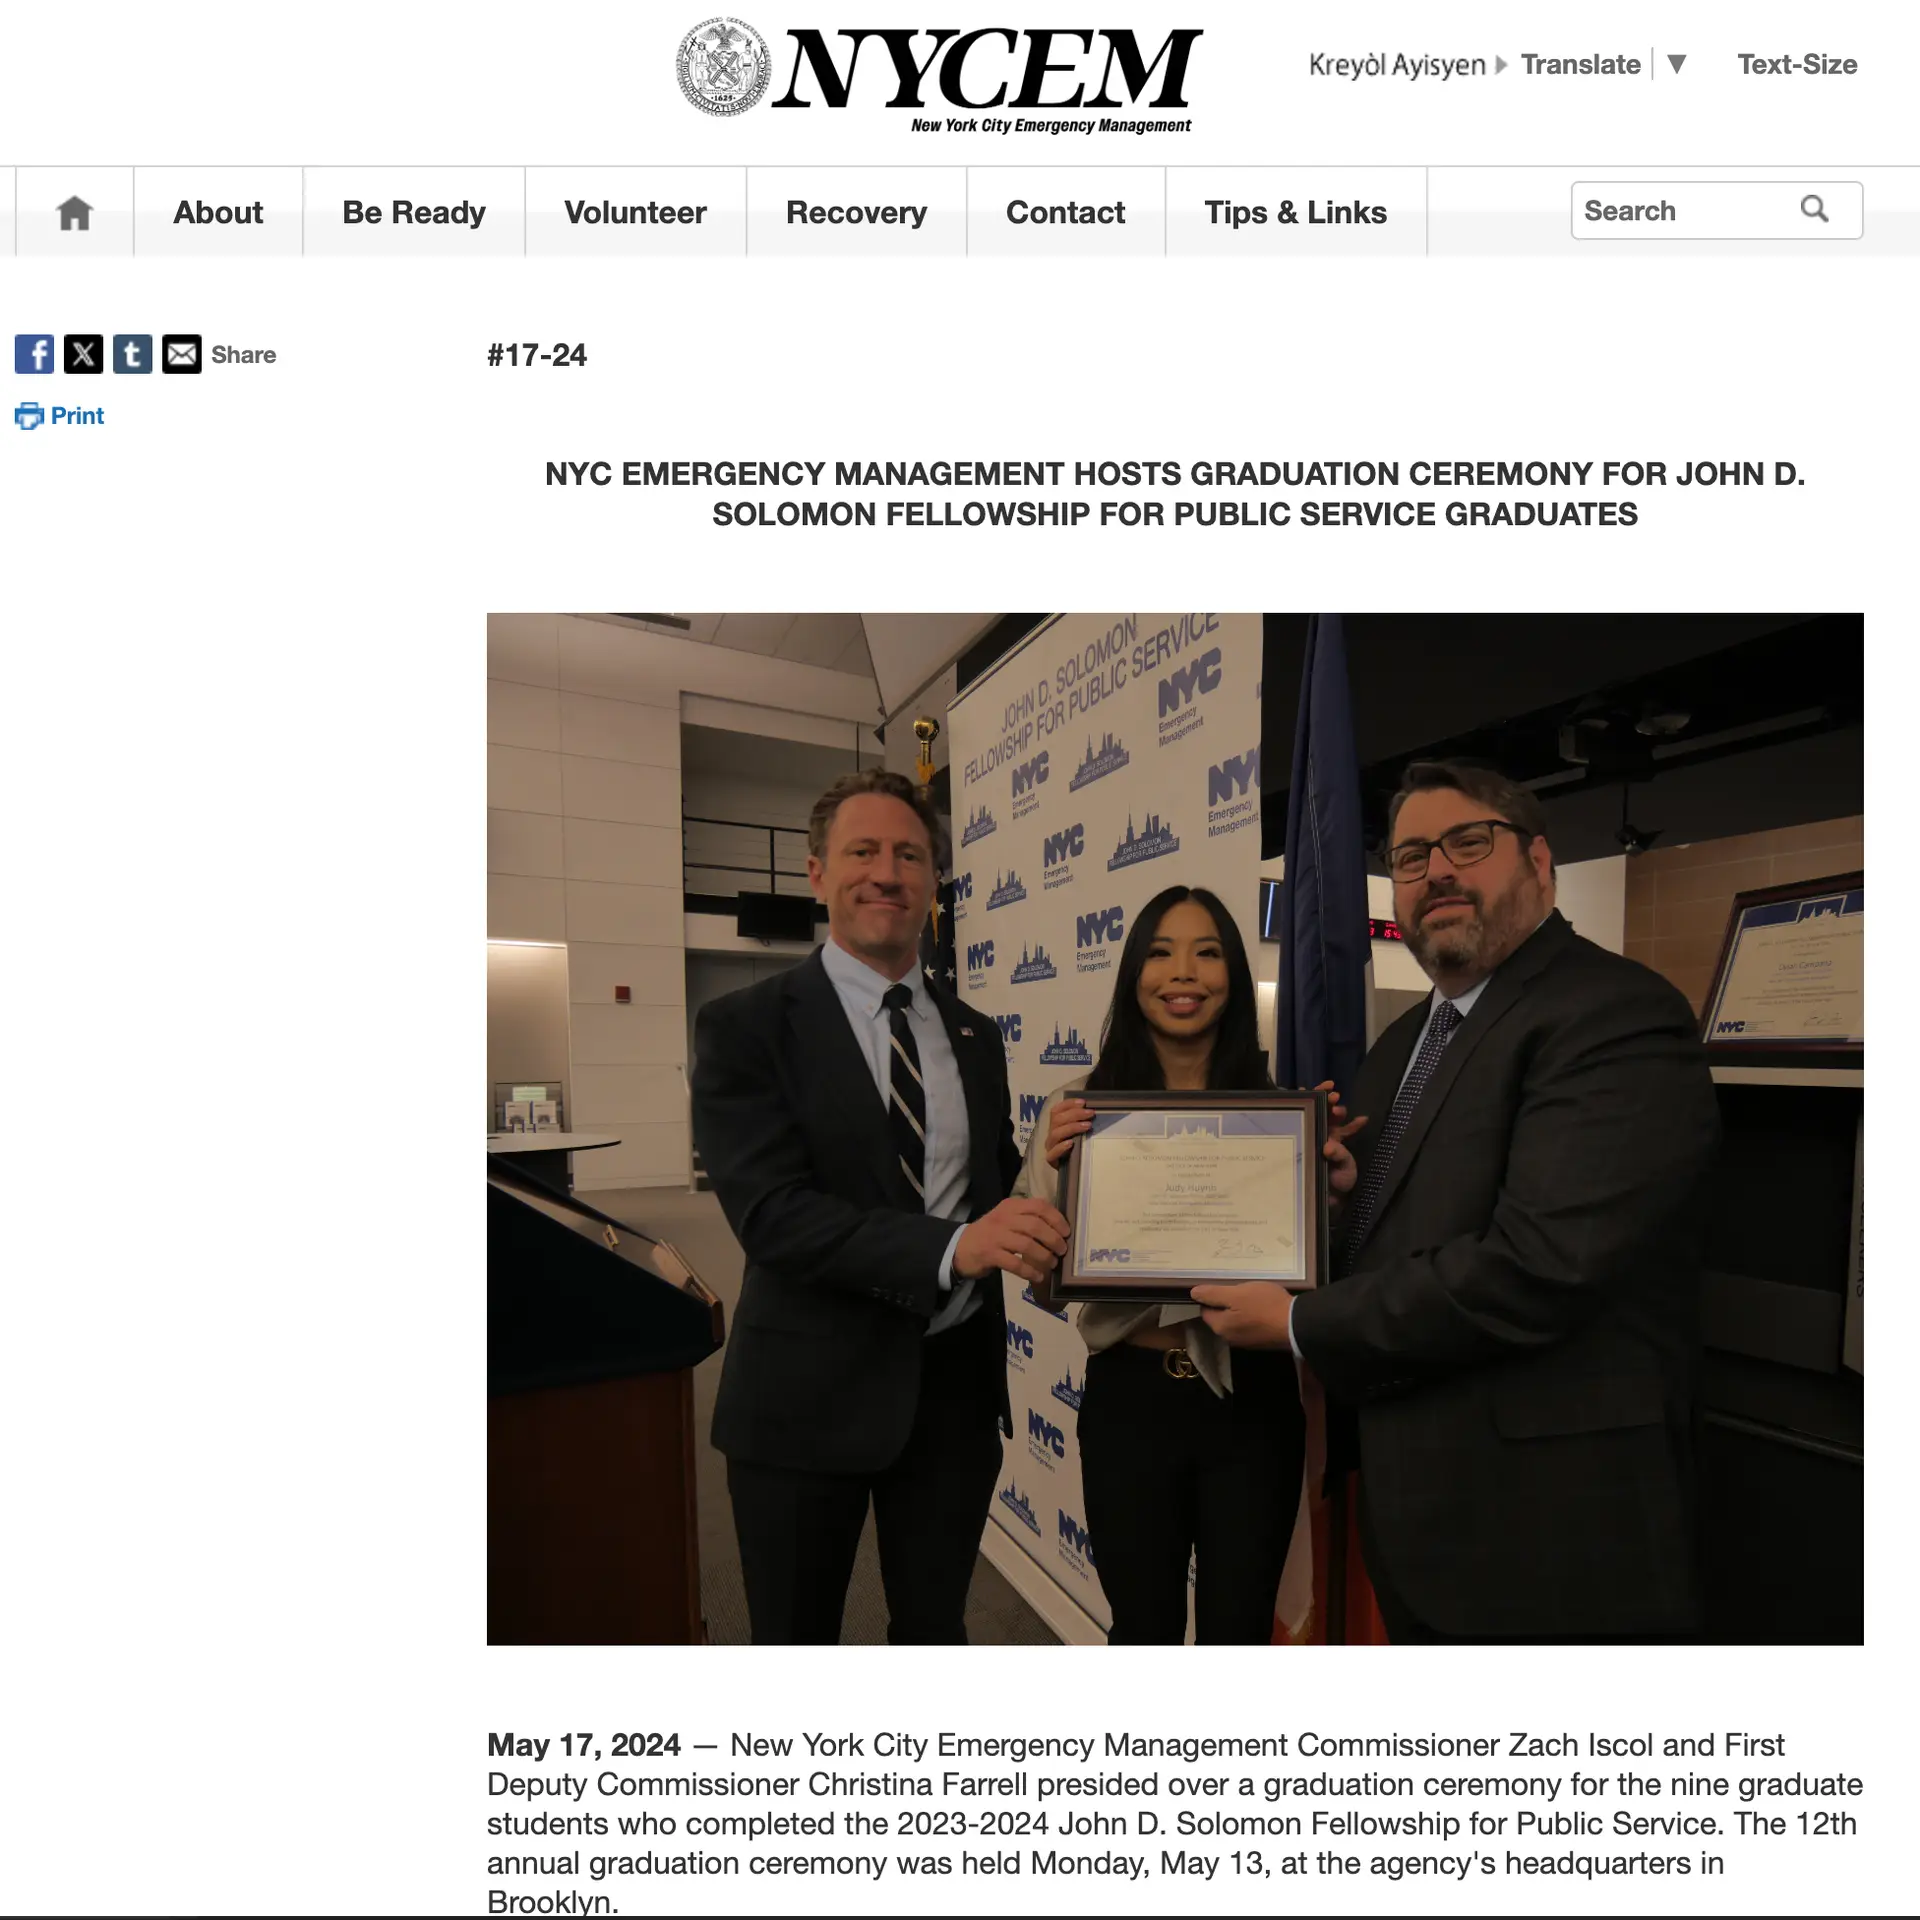
NYC Emergency Management: John D. Solomon Fellowship graduation →
My blog post: My Journey Inside New York City’s Shield →
Mapbox GL JS · Mapbox Storytelling template · JavaScript · Bootstrap · QGIS · Datawrapper · GitHub Pages
I cut the Miami case study, because the map’s users were New York City staff and every example should be one they can act on.
I switched to the 2050s floodplain, because a map about who gets priced out over the coming decades should show where the water is expected then.
05
What it found
- In the Rockaways, the map counts 6,179 people in five NYCHA public housing developments where average rents ran from $453 to $548 a month.
- By the city planning department’s count, more than 400,000 New Yorkers lived in the 1% annual chance floodplain in 2020, and more than 780,000 counting the wider area with a 0.2% (1 in 500) chance of flooding each year.
06
Where it went next
- 13 May 2024: finished the John D. Solomon Fellowship at NYC Emergency Management’s graduation ceremony in Brooklyn. My fellowship poster had a QR code to the map.
- April 2025: the 2024 NYC Risk Landscape, part of the city’s Hazard Mitigation Plan that I worked on during the same fellowship, credits me as a contributor under my title, John D. Solomon Fellow.
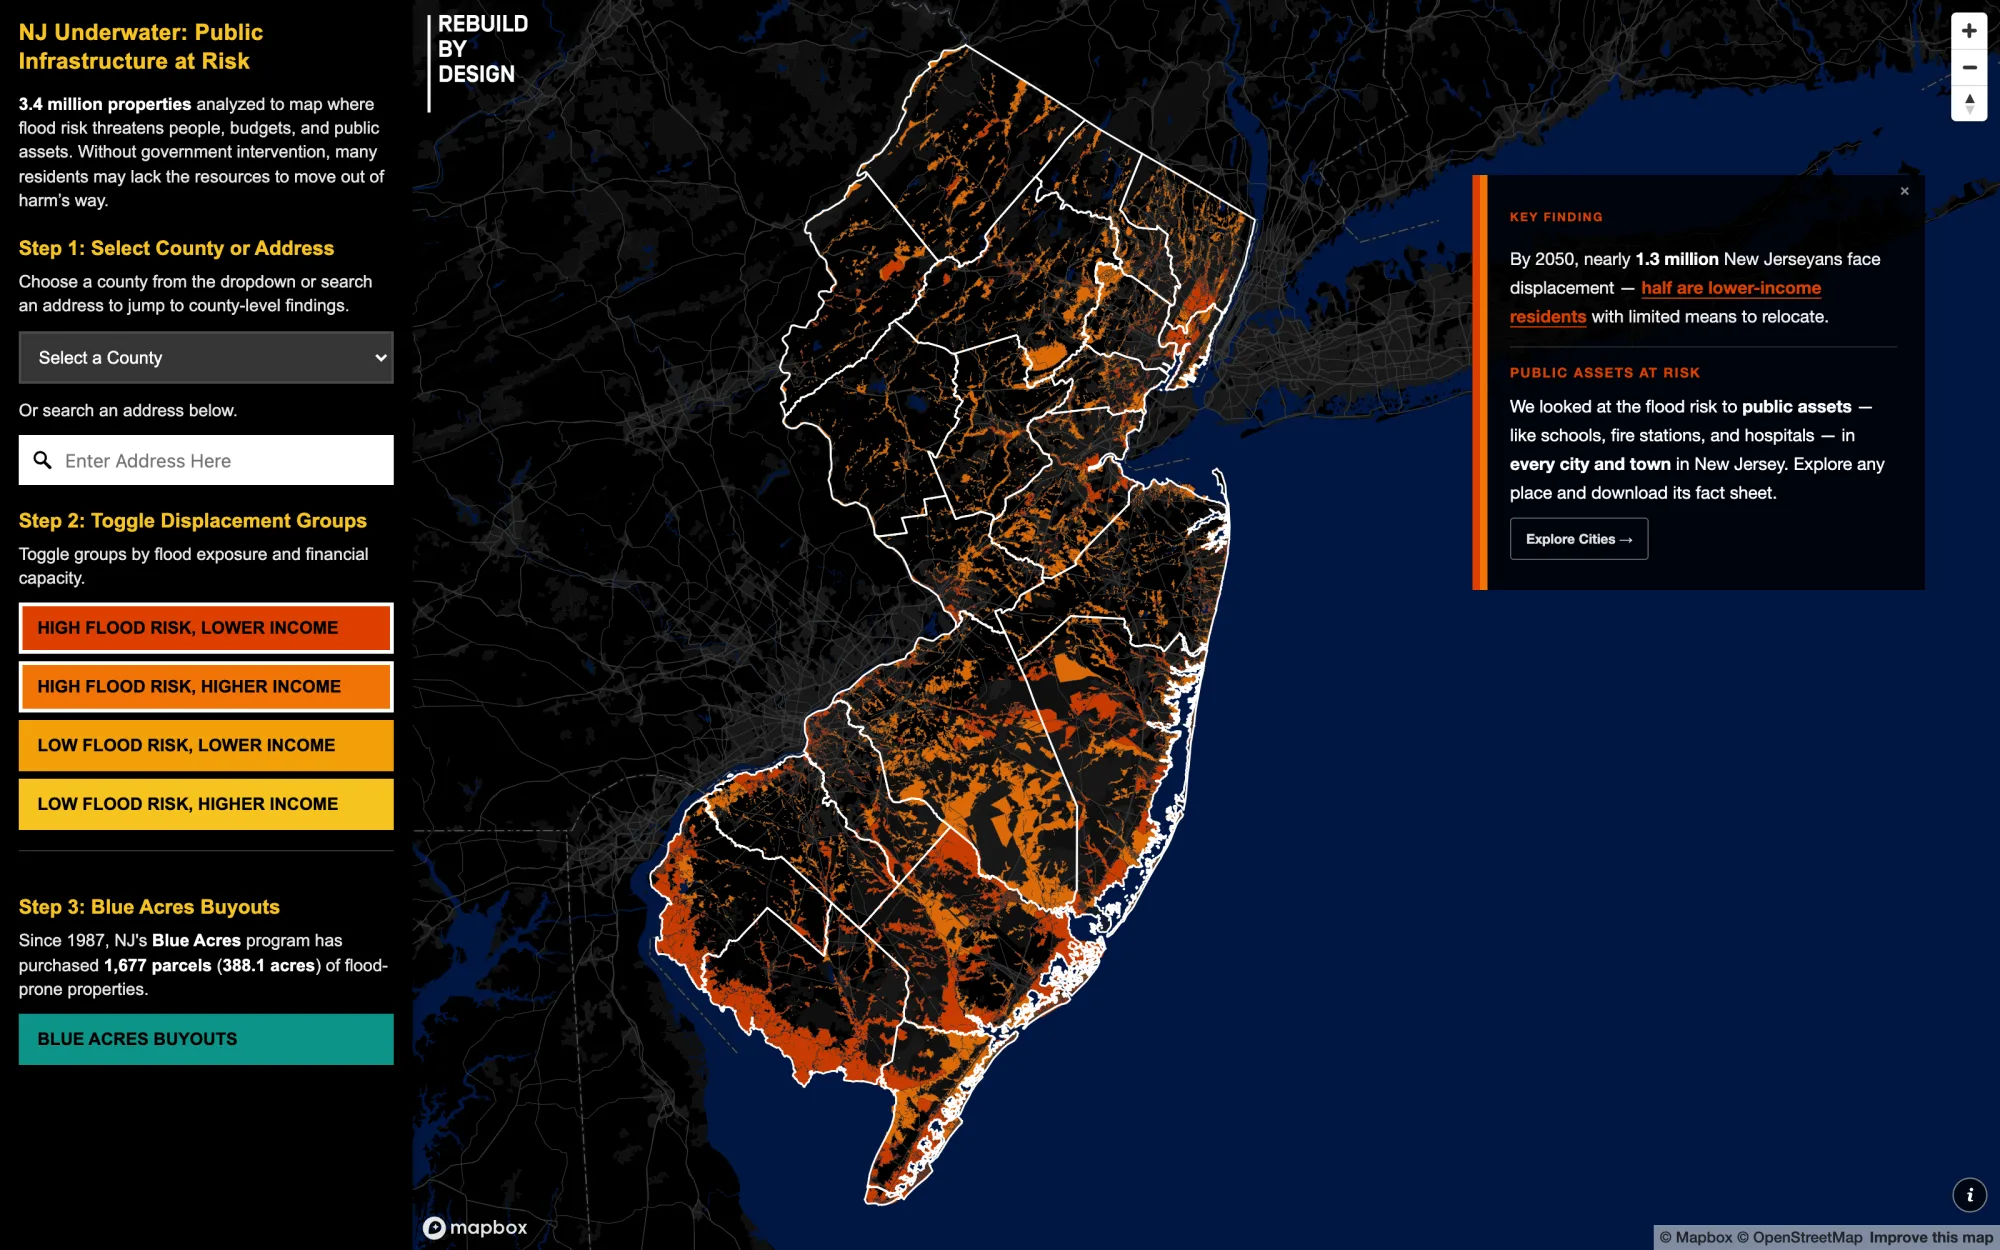
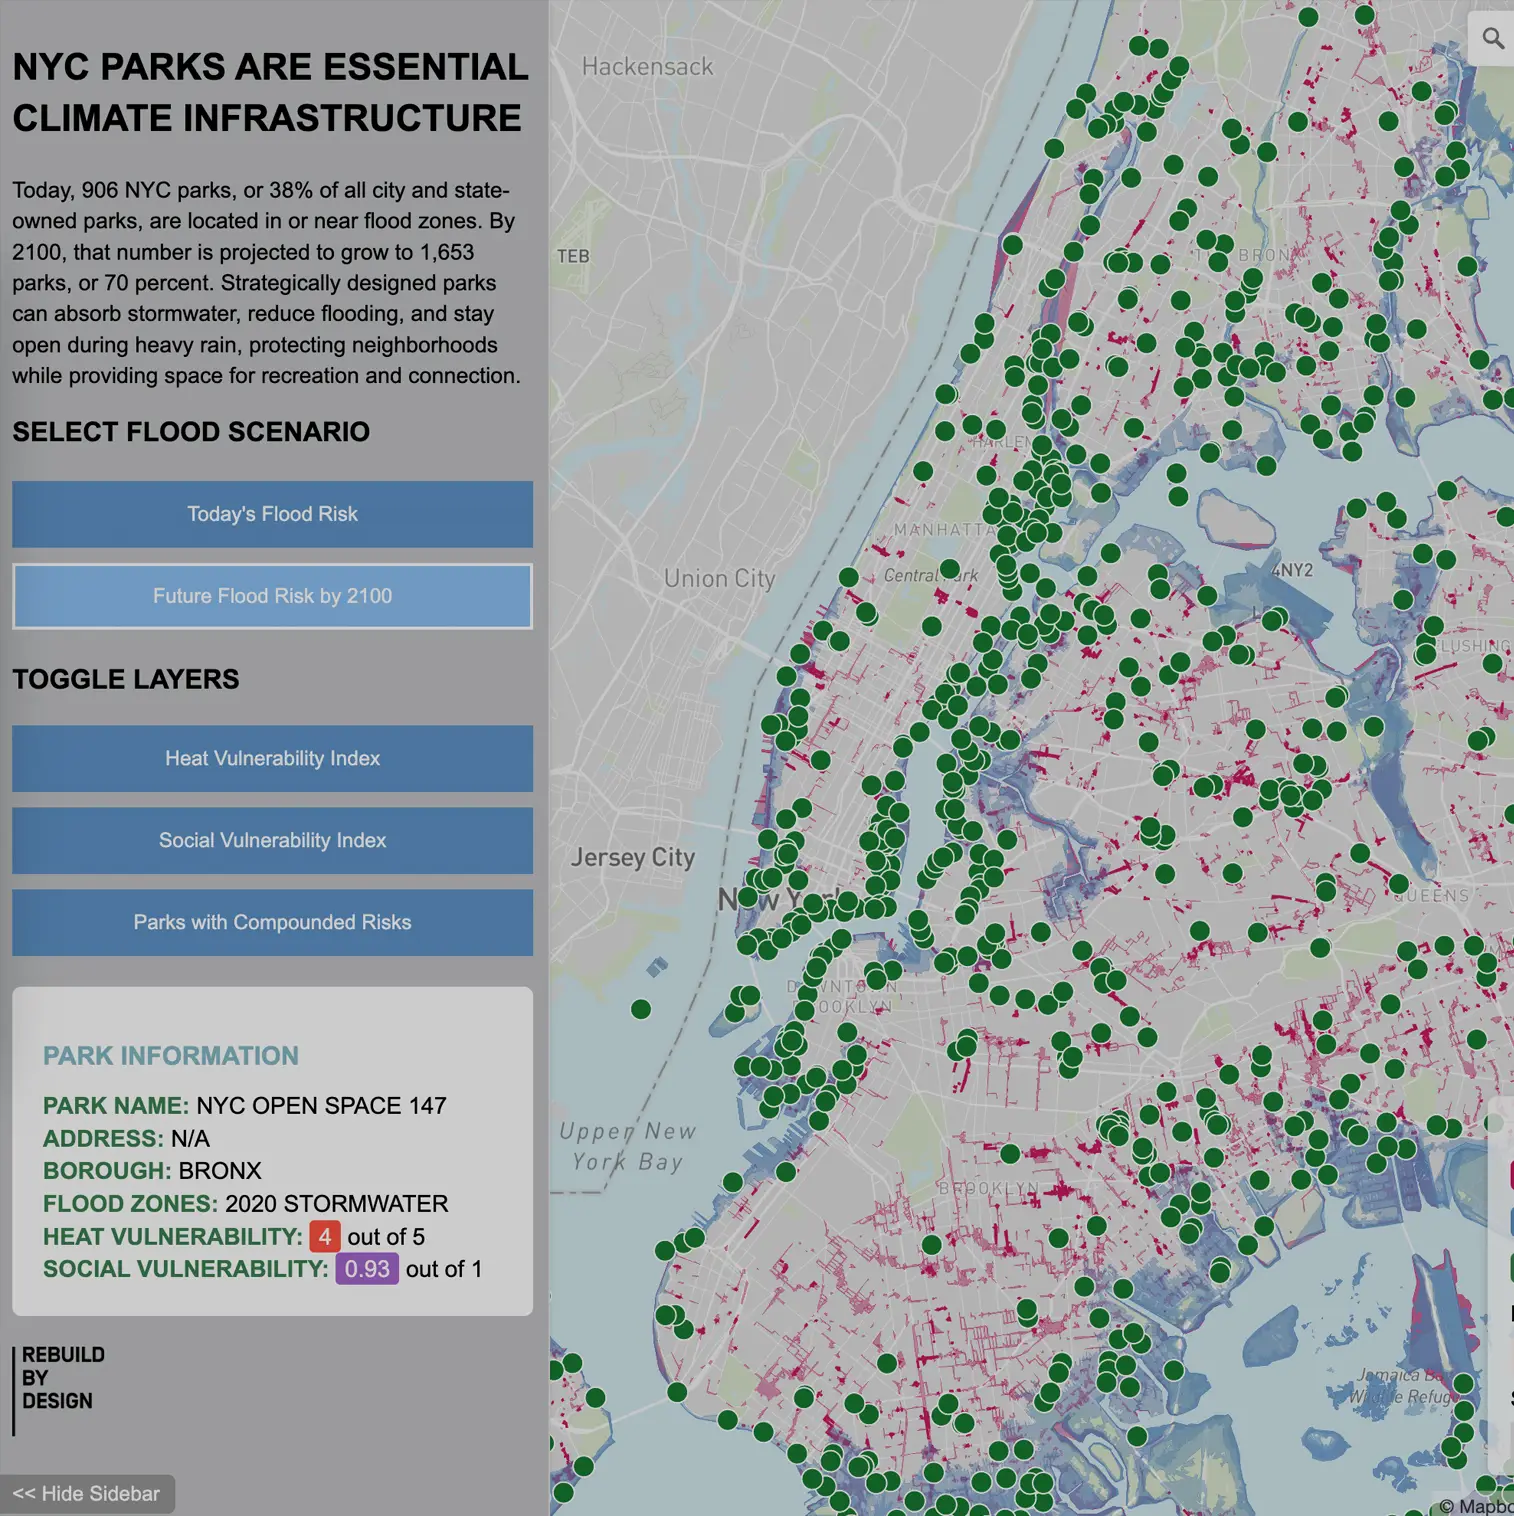
- After the fellowship I went full-time at Rebuild by Design, where I keep building maps about flood risk and housing.