Flood maps show where water is likely to go. They are useful, and many of them are out of date. The Congressional Budget Office estimates that about 40 to 50 percent of flood damage happens outside the areas FEMA marks as high risk.
But even a perfect map would miss the thing that most often decides how a storm ends for a family. It can’t show you who knocks on the door of the basement apartment when the water starts rising.
Two neighbourhoods, one heat wave
In July 1995, a heat wave killed hundreds of people in Chicago. The sociologist Eric Klinenberg later compared two neighbourhoods side by side. On paper they looked alike: similar incomes, similar exposure to the heat.
In North Lawndale, the death rate was about 40 per 100,000 people. Next door in Little Village, it was about 4 per 100,000. Ten times lower.
The difference wasn’t air conditioning or family size. Little Village had busy sidewalks, open shops and people who knew each other. Older residents had reasons and places to leave their hot apartments, and neighbours who noticed when they didn’t.
Nobody would have put that on a hazard map.
Who recovers first
The political scientist Daniel Aldrich studied recovery after disasters from Kobe to New Orleans and kept finding the same pattern. The places with stronger social ties recovered faster. After Hurricane Katrina, the Vietnamese community around Mary Queen of Vietnam church in New Orleans East came back sooner than many other neighbourhoods. They already shared a church, a language and a habit of showing up for each other.
Trust is infrastructure. It just doesn’t come with a ribbon cutting.
What a block party is actually telling you
So think about a block party differently.
To throw one, someone had to get a permit, knock on doors, borrow tables and find out who is allergic to what. A street that can do that already knows who lives alone, who uses a wheelchair and who owns a pump. It has a group chat. It has people who are used to asking each other for things.
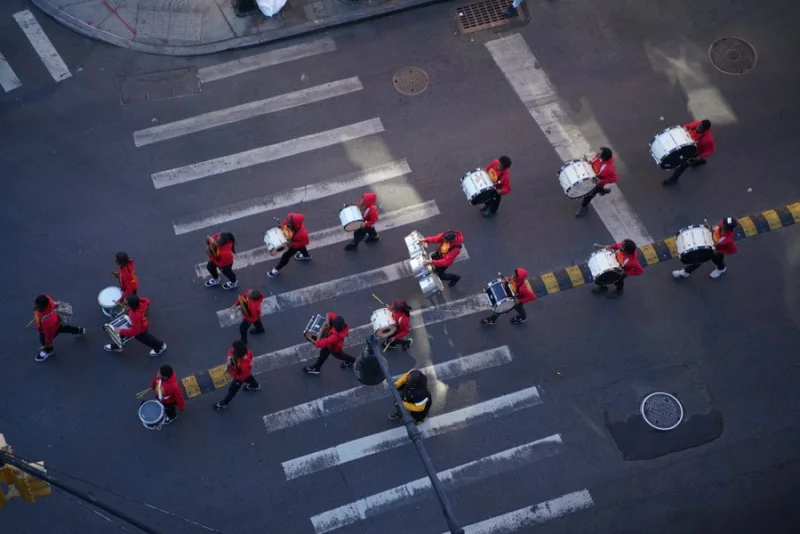
Don’t underestimate the importance of observation. The assets of a space sometimes can’t be quantified in data.
That is exactly the network you need when the storm drains back up at 2 am. Block parties, community gardens, busy storefronts, a well used library: these are signals of a neighbourhood’s health, and they are also signals of how it will handle the next emergency.
The layer we don’t map
When people share what happened on their street during a flood, the questions that keep coming up are simple ones. Where do you go? Who do you call? Those answers live in relationships, not in elevation data.
The flood map is one layer. We have good data for the water. We have almost none for the connective tissue: the trust, the habits, the places where neighbours run into each other.
How do we find that connected tissue?
Imagine if we treated that as seriously as we treat pipes. If a permit for a block party counted as a small investment in emergency readiness. If libraries and laundromats and places of worship showed up in resilience plans as the social infrastructure they are.
Talk about the PEOPLE first vs. the land.
We spend a lot of energy updating maps of where the water will go. It might be just as worth asking which streets would be ready for it together.